Immigrants from Germany vs Immigrants from Congo Unemployment Among Women with Children Ages 6 to 17 years
COMPARE
Immigrants from Germany
Immigrants from Congo
Unemployment Among Women with Children Ages 6 to 17 years
Unemployment Among Women with Children Ages 6 to 17 years Comparison
Immigrants from Germany
Immigrants from Congo
9.2%
UNEMPLOYMENT AMONG WOMEN WITH CHILDREN AGES 6 TO 17 YEARS
7.2/ 100
METRIC RATING
215th/ 347
METRIC RANK
9.0%
UNEMPLOYMENT AMONG WOMEN WITH CHILDREN AGES 6 TO 17 YEARS
32.5/ 100
METRIC RATING
185th/ 347
METRIC RANK
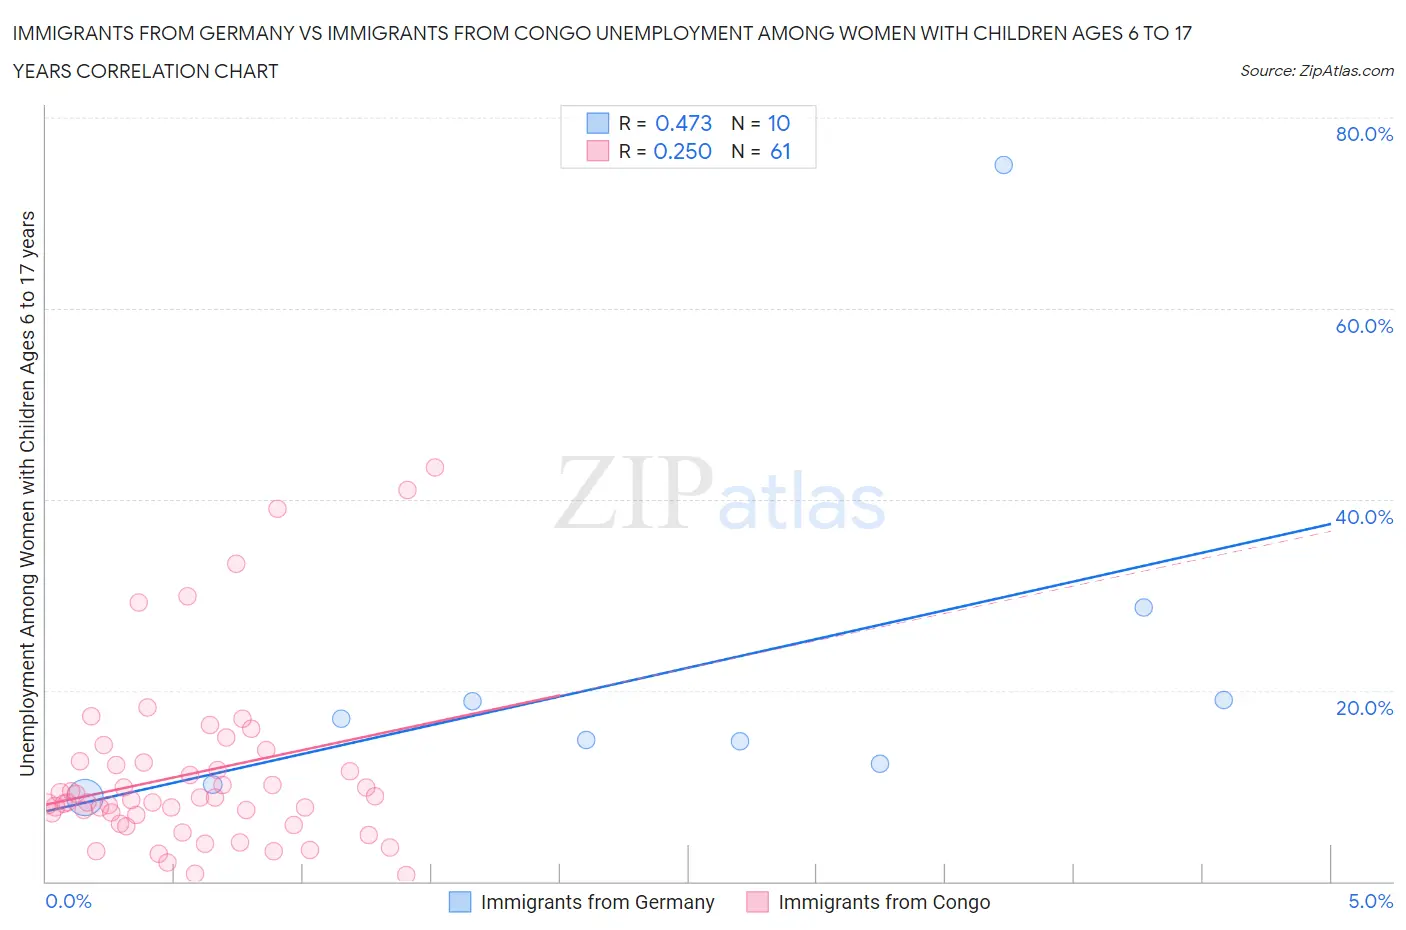
Immigrants from Germany vs Immigrants from Congo Unemployment Among Women with Children Ages 6 to 17 years Correlation Chart
The statistical analysis conducted on geographies consisting of 317,293,448 people shows a moderate positive correlation between the proportion of Immigrants from Germany and unemployment rate among women with children between the ages 6 and 17 in the United States with a correlation coefficient (R) of 0.473 and weighted average of 9.2%. Similarly, the statistical analysis conducted on geographies consisting of 83,229,109 people shows a weak positive correlation between the proportion of Immigrants from Congo and unemployment rate among women with children between the ages 6 and 17 in the United States with a correlation coefficient (R) of 0.250 and weighted average of 9.0%, a difference of 2.0%.
Unemployment Among Women with Children Ages 6 to 17 years Correlation Summary
| Measurement | Immigrants from Germany | Immigrants from Congo |
| Minimum | 8.7% | 0.70% |
| Maximum | 75.1% | 43.4% |
| Range | 66.3% | 42.7% |
| Mean | 21.9% | 11.3% |
| Median | 15.9% | 8.5% |
| Interquartile 25% (IQ1) | 12.3% | 6.5% |
| Interquartile 75% (IQ3) | 19.0% | 12.5% |
| Interquartile Range (IQR) | 6.7% | 5.9% |
| Standard Deviation (Sample) | 19.5% | 9.3% |
| Standard Deviation (Population) | 18.5% | 9.2% |
Similar Demographics by Unemployment Among Women with Children Ages 6 to 17 years
Demographics Similar to Immigrants from Germany by Unemployment Among Women with Children Ages 6 to 17 years
In terms of unemployment among women with children ages 6 to 17 years, the demographic groups most similar to Immigrants from Germany are Immigrants from Uruguay (9.2%, a difference of 0.0%), German (9.2%, a difference of 0.010%), Iroquois (9.2%, a difference of 0.040%), Syrian (9.2%, a difference of 0.060%), and Immigrants from Scotland (9.2%, a difference of 0.11%).
| Demographics | Rating | Rank | Unemployment Among Women with Children Ages 6 to 17 years |
| Immigrants | Peru | 10.8 /100 | #208 | Poor 9.2% |
| Salvadorans | 10.7 /100 | #209 | Poor 9.2% |
| Finns | 10.0 /100 | #210 | Tragic 9.2% |
| Immigrants | Cuba | 9.6 /100 | #211 | Tragic 9.2% |
| Peruvians | 9.0 /100 | #212 | Tragic 9.2% |
| Spaniards | 8.2 /100 | #213 | Tragic 9.2% |
| Iroquois | 7.5 /100 | #214 | Tragic 9.2% |
| Immigrants | Germany | 7.2 /100 | #215 | Tragic 9.2% |
| Immigrants | Uruguay | 7.2 /100 | #216 | Tragic 9.2% |
| Germans | 7.2 /100 | #217 | Tragic 9.2% |
| Syrians | 6.9 /100 | #218 | Tragic 9.2% |
| Immigrants | Scotland | 6.6 /100 | #219 | Tragic 9.2% |
| Belgians | 6.4 /100 | #220 | Tragic 9.2% |
| Crow | 5.8 /100 | #221 | Tragic 9.2% |
| Immigrants | Southern Europe | 5.8 /100 | #222 | Tragic 9.2% |
Demographics Similar to Immigrants from Congo by Unemployment Among Women with Children Ages 6 to 17 years
In terms of unemployment among women with children ages 6 to 17 years, the demographic groups most similar to Immigrants from Congo are Immigrants from Spain (9.0%, a difference of 0.010%), Palestinian (9.0%, a difference of 0.040%), Swiss (9.0%, a difference of 0.050%), South American Indian (9.0%, a difference of 0.090%), and Immigrants from Czechoslovakia (9.0%, a difference of 0.10%).
| Demographics | Rating | Rank | Unemployment Among Women with Children Ages 6 to 17 years |
| Menominee | 39.3 /100 | #178 | Fair 9.0% |
| Immigrants | Zaire | 38.3 /100 | #179 | Fair 9.0% |
| Ethiopians | 37.6 /100 | #180 | Fair 9.0% |
| Immigrants | Czechoslovakia | 34.5 /100 | #181 | Fair 9.0% |
| South American Indians | 34.4 /100 | #182 | Fair 9.0% |
| Swiss | 33.5 /100 | #183 | Fair 9.0% |
| Palestinians | 33.4 /100 | #184 | Fair 9.0% |
| Immigrants | Congo | 32.5 /100 | #185 | Fair 9.0% |
| Immigrants | Spain | 32.4 /100 | #186 | Fair 9.0% |
| Comanche | 30.0 /100 | #187 | Fair 9.0% |
| Immigrants | Syria | 29.7 /100 | #188 | Fair 9.1% |
| Immigrants | Immigrants | 29.2 /100 | #189 | Fair 9.1% |
| Slovenes | 28.5 /100 | #190 | Fair 9.1% |
| Belizeans | 28.4 /100 | #191 | Fair 9.1% |
| Guamanians/Chamorros | 27.2 /100 | #192 | Fair 9.1% |