Salvadoran vs Delaware Female Unemployment
COMPARE
Salvadoran
Delaware
Female Unemployment
Female Unemployment Comparison
Salvadorans
Delaware
6.0%
FEMALE UNEMPLOYMENT
0.0/ 100
METRIC RATING
283rd/ 347
METRIC RANK
5.5%
FEMALE UNEMPLOYMENT
7.2/ 100
METRIC RATING
223rd/ 347
METRIC RANK
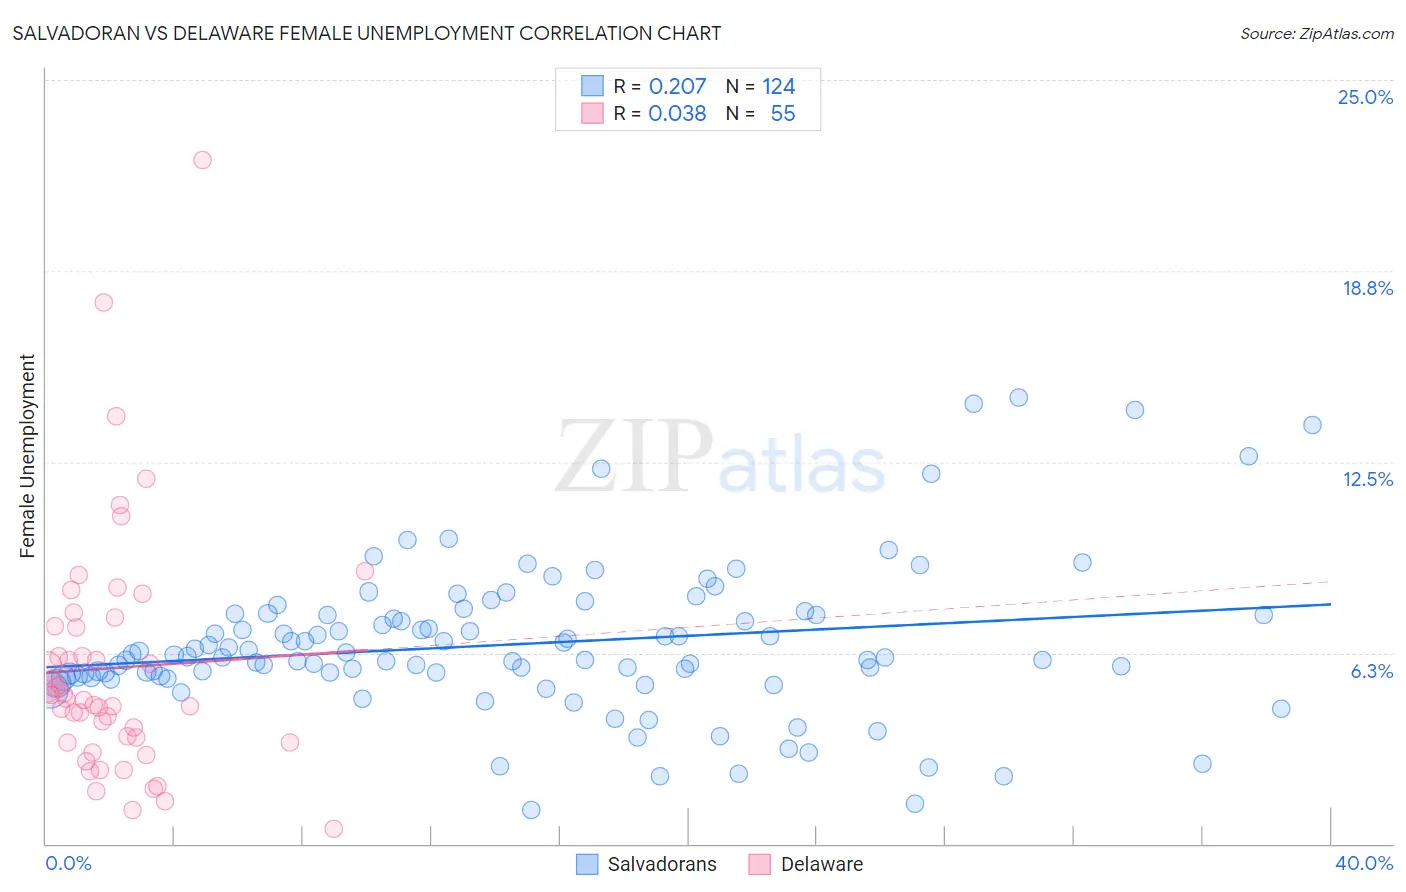
Salvadoran vs Delaware Female Unemployment Correlation Chart
The statistical analysis conducted on geographies consisting of 397,211,124 people shows a weak positive correlation between the proportion of Salvadorans and unemploymnet rate among females in the United States with a correlation coefficient (R) of 0.207 and weighted average of 6.0%. Similarly, the statistical analysis conducted on geographies consisting of 96,046,928 people shows no correlation between the proportion of Delaware and unemploymnet rate among females in the United States with a correlation coefficient (R) of 0.038 and weighted average of 5.5%, a difference of 10.6%.
Female Unemployment Correlation Summary
| Measurement | Salvadoran | Delaware |
| Minimum | 1.1% | 0.50% |
| Maximum | 14.6% | 22.4% |
| Range | 13.5% | 21.9% |
| Mean | 6.5% | 5.8% |
| Median | 6.1% | 4.8% |
| Interquartile 25% (IQ1) | 5.5% | 3.3% |
| Interquartile 75% (IQ3) | 7.5% | 7.1% |
| Interquartile Range (IQR) | 2.0% | 3.8% |
| Standard Deviation (Sample) | 2.4% | 4.0% |
| Standard Deviation (Population) | 2.4% | 3.9% |
Similar Demographics by Female Unemployment
Demographics Similar to Salvadorans by Female Unemployment
In terms of female unemployment, the demographic groups most similar to Salvadorans are Colville (6.0%, a difference of 0.10%), Immigrants from Senegal (6.1%, a difference of 0.34%), Guatemalan (6.0%, a difference of 0.37%), Mexican American Indian (6.0%, a difference of 0.41%), and Armenian (6.0%, a difference of 0.47%).
| Demographics | Rating | Rank | Female Unemployment |
| Bahamians | 0.0 /100 | #276 | Tragic 6.0% |
| Immigrants | Ghana | 0.0 /100 | #277 | Tragic 6.0% |
| Yaqui | 0.0 /100 | #278 | Tragic 6.0% |
| Armenians | 0.0 /100 | #279 | Tragic 6.0% |
| Mexican American Indians | 0.0 /100 | #280 | Tragic 6.0% |
| Guatemalans | 0.0 /100 | #281 | Tragic 6.0% |
| Colville | 0.0 /100 | #282 | Tragic 6.0% |
| Salvadorans | 0.0 /100 | #283 | Tragic 6.0% |
| Immigrants | Senegal | 0.0 /100 | #284 | Tragic 6.1% |
| Immigrants | Cabo Verde | 0.0 /100 | #285 | Tragic 6.1% |
| Chippewa | 0.0 /100 | #286 | Tragic 6.1% |
| Immigrants | Guatemala | 0.0 /100 | #287 | Tragic 6.1% |
| Haitians | 0.0 /100 | #288 | Tragic 6.1% |
| Trinidadians and Tobagonians | 0.0 /100 | #289 | Tragic 6.1% |
| Immigrants | Caribbean | 0.0 /100 | #290 | Tragic 6.1% |
Demographics Similar to Delaware by Female Unemployment
In terms of female unemployment, the demographic groups most similar to Delaware are Nicaraguan (5.5%, a difference of 0.010%), Brazilian (5.5%, a difference of 0.030%), Iraqi (5.5%, a difference of 0.030%), French American Indian (5.5%, a difference of 0.25%), and Immigrants from Africa (5.4%, a difference of 0.27%).
| Demographics | Rating | Rank | Female Unemployment |
| Comanche | 10.0 /100 | #216 | Poor 5.4% |
| Peruvians | 9.6 /100 | #217 | Tragic 5.4% |
| Bermudans | 9.0 /100 | #218 | Tragic 5.4% |
| South Americans | 8.6 /100 | #219 | Tragic 5.4% |
| Immigrants | Africa | 8.5 /100 | #220 | Tragic 5.4% |
| Brazilians | 7.3 /100 | #221 | Tragic 5.5% |
| Nicaraguans | 7.2 /100 | #222 | Tragic 5.5% |
| Delaware | 7.2 /100 | #223 | Tragic 5.5% |
| Iraqis | 7.1 /100 | #224 | Tragic 5.5% |
| French American Indians | 6.1 /100 | #225 | Tragic 5.5% |
| Immigrants | Peru | 5.9 /100 | #226 | Tragic 5.5% |
| Immigrants | Philippines | 5.3 /100 | #227 | Tragic 5.5% |
| Israelis | 4.8 /100 | #228 | Tragic 5.5% |
| Panamanians | 4.7 /100 | #229 | Tragic 5.5% |
| Immigrants | Uruguay | 4.7 /100 | #230 | Tragic 5.5% |