Immigrants from Israel vs Delaware Female Unemployment
COMPARE
Immigrants from Israel
Delaware
Female Unemployment
Female Unemployment Comparison
Immigrants from Israel
Delaware
5.4%
FEMALE UNEMPLOYMENT
19.7/ 100
METRIC RATING
204th/ 347
METRIC RANK
5.5%
FEMALE UNEMPLOYMENT
7.2/ 100
METRIC RATING
223rd/ 347
METRIC RANK
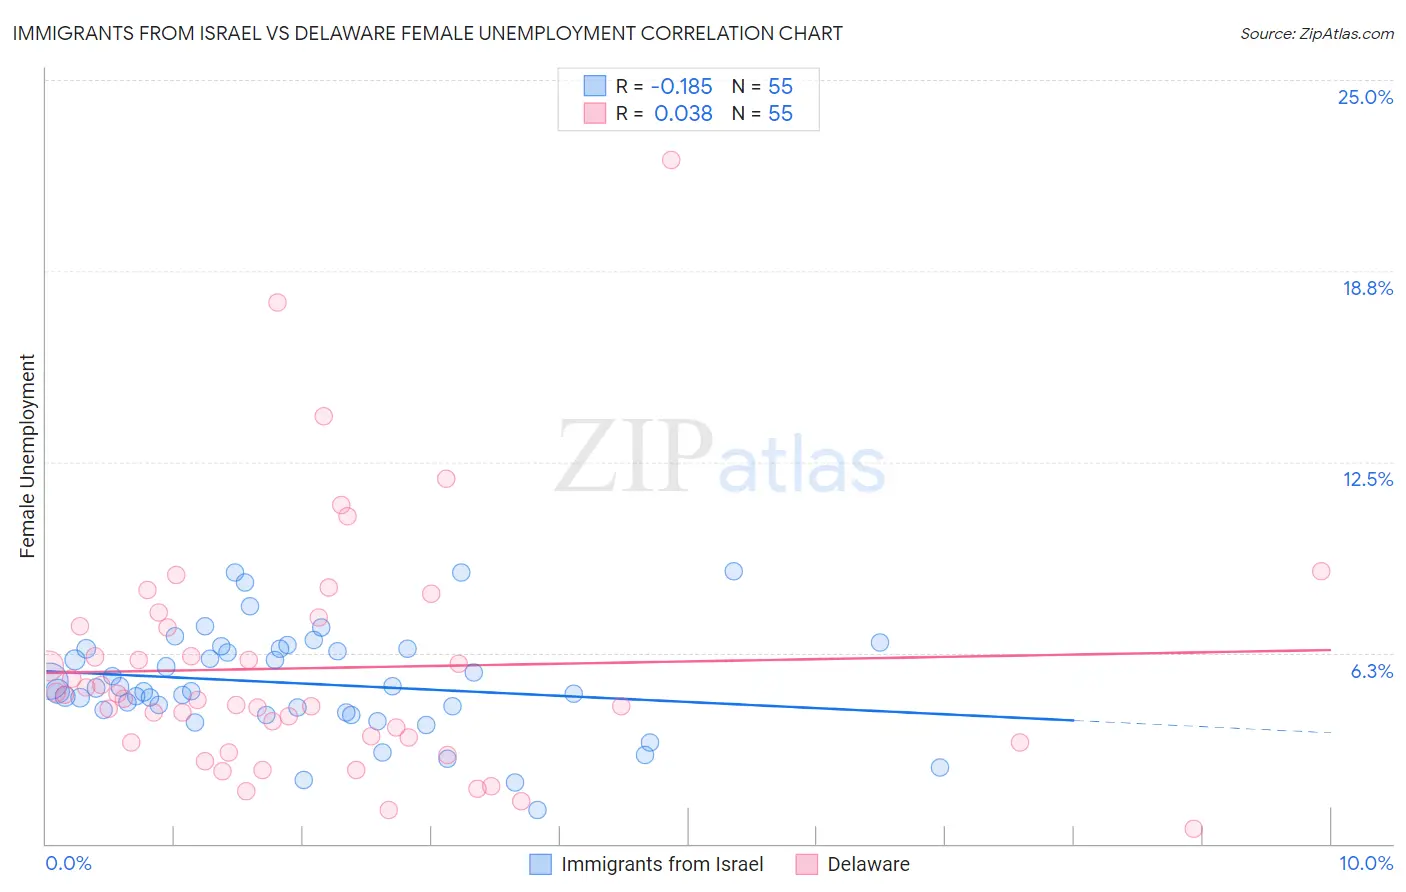
Immigrants from Israel vs Delaware Female Unemployment Correlation Chart
The statistical analysis conducted on geographies consisting of 209,717,487 people shows a poor negative correlation between the proportion of Immigrants from Israel and unemploymnet rate among females in the United States with a correlation coefficient (R) of -0.185 and weighted average of 5.4%. Similarly, the statistical analysis conducted on geographies consisting of 96,046,928 people shows no correlation between the proportion of Delaware and unemploymnet rate among females in the United States with a correlation coefficient (R) of 0.038 and weighted average of 5.5%, a difference of 1.7%.
Female Unemployment Correlation Summary
| Measurement | Immigrants from Israel | Delaware |
| Minimum | 1.1% | 0.50% |
| Maximum | 8.9% | 22.4% |
| Range | 7.8% | 21.9% |
| Mean | 5.2% | 5.8% |
| Median | 5.0% | 4.8% |
| Interquartile 25% (IQ1) | 4.3% | 3.3% |
| Interquartile 75% (IQ3) | 6.4% | 7.1% |
| Interquartile Range (IQR) | 2.1% | 3.8% |
| Standard Deviation (Sample) | 1.7% | 4.0% |
| Standard Deviation (Population) | 1.7% | 3.9% |
Demographics Similar to Immigrants from Israel and Delaware by Female Unemployment
In terms of female unemployment, the demographic groups most similar to Immigrants from Israel are Immigrants from South Eastern Asia (5.4%, a difference of 0.060%), Immigrants from Afghanistan (5.4%, a difference of 0.070%), Immigrants from Brazil (5.4%, a difference of 0.090%), Creek (5.4%, a difference of 0.44%), and Immigrants from Costa Rica (5.4%, a difference of 0.64%). Similarly, the demographic groups most similar to Delaware are Nicaraguan (5.5%, a difference of 0.010%), Brazilian (5.5%, a difference of 0.030%), Immigrants from Africa (5.4%, a difference of 0.27%), South American (5.4%, a difference of 0.29%), and Bermudan (5.4%, a difference of 0.36%).
| Demographics | Rating | Rank | Female Unemployment |
| Immigrants | South Eastern Asia | 20.3 /100 | #203 | Fair 5.4% |
| Immigrants | Israel | 19.7 /100 | #204 | Poor 5.4% |
| Immigrants | Afghanistan | 18.9 /100 | #205 | Poor 5.4% |
| Immigrants | Brazil | 18.8 /100 | #206 | Poor 5.4% |
| Creek | 15.4 /100 | #207 | Poor 5.4% |
| Immigrants | Costa Rica | 13.7 /100 | #208 | Poor 5.4% |
| Koreans | 13.4 /100 | #209 | Poor 5.4% |
| Choctaw | 12.3 /100 | #210 | Poor 5.4% |
| Ottawa | 11.6 /100 | #211 | Poor 5.4% |
| Uruguayans | 11.4 /100 | #212 | Poor 5.4% |
| Samoans | 10.6 /100 | #213 | Poor 5.4% |
| Seminole | 10.3 /100 | #214 | Poor 5.4% |
| Immigrants | Nicaragua | 10.2 /100 | #215 | Poor 5.4% |
| Comanche | 10.0 /100 | #216 | Poor 5.4% |
| Peruvians | 9.6 /100 | #217 | Tragic 5.4% |
| Bermudans | 9.0 /100 | #218 | Tragic 5.4% |
| South Americans | 8.6 /100 | #219 | Tragic 5.4% |
| Immigrants | Africa | 8.5 /100 | #220 | Tragic 5.4% |
| Brazilians | 7.3 /100 | #221 | Tragic 5.5% |
| Nicaraguans | 7.2 /100 | #222 | Tragic 5.5% |
| Delaware | 7.2 /100 | #223 | Tragic 5.5% |