British West Indian vs Delaware Female Unemployment
COMPARE
British West Indian
Delaware
Female Unemployment
Female Unemployment Comparison
British West Indians
Delaware
6.4%
FEMALE UNEMPLOYMENT
0.0/ 100
METRIC RATING
318th/ 347
METRIC RANK
5.5%
FEMALE UNEMPLOYMENT
7.2/ 100
METRIC RATING
223rd/ 347
METRIC RANK
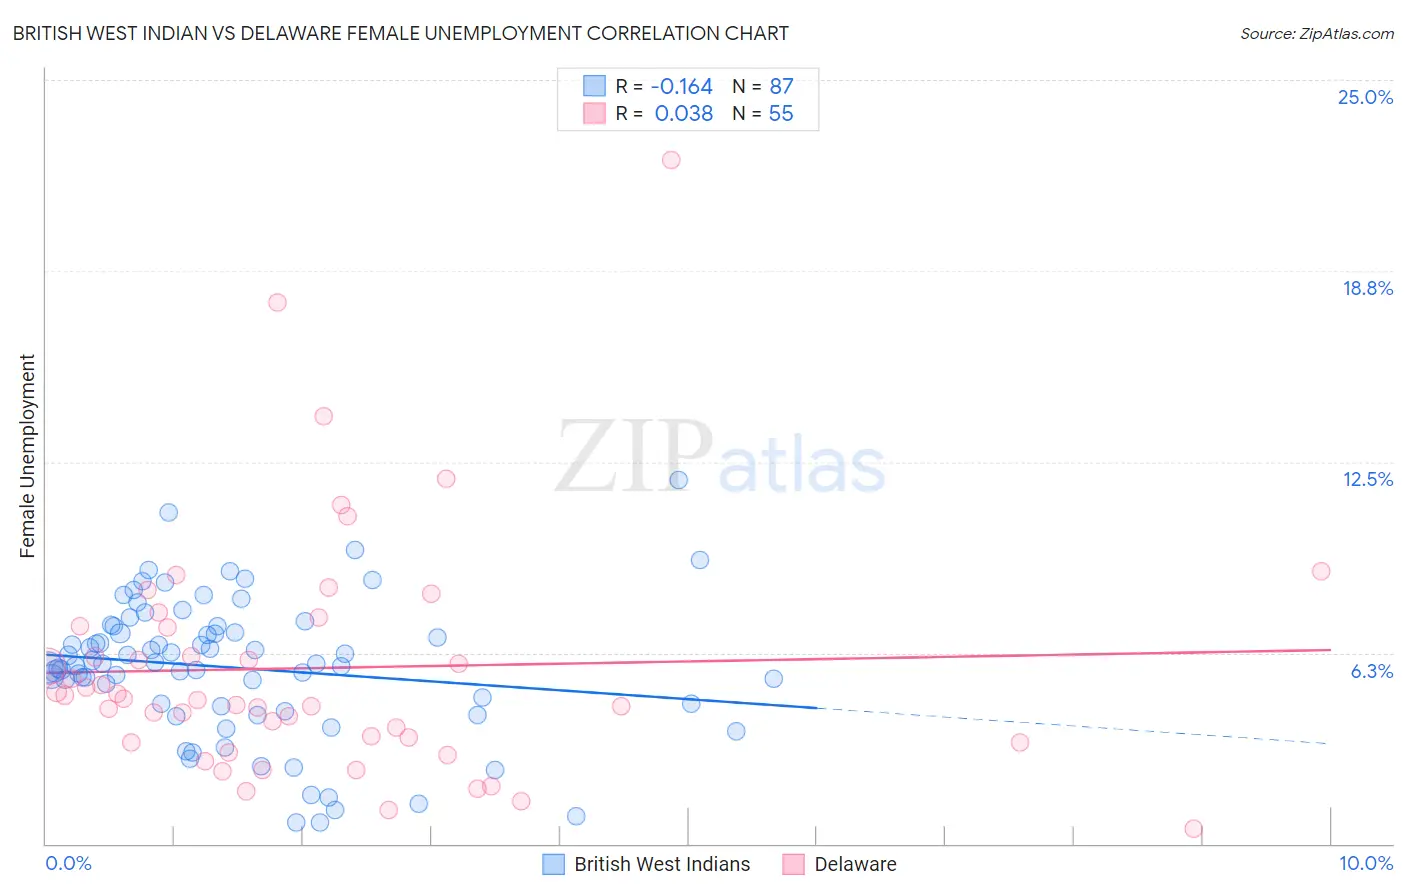
British West Indian vs Delaware Female Unemployment Correlation Chart
The statistical analysis conducted on geographies consisting of 152,545,495 people shows a poor negative correlation between the proportion of British West Indians and unemploymnet rate among females in the United States with a correlation coefficient (R) of -0.164 and weighted average of 6.4%. Similarly, the statistical analysis conducted on geographies consisting of 96,046,928 people shows no correlation between the proportion of Delaware and unemploymnet rate among females in the United States with a correlation coefficient (R) of 0.038 and weighted average of 5.5%, a difference of 18.0%.
Female Unemployment Correlation Summary
| Measurement | British West Indian | Delaware |
| Minimum | 0.70% | 0.50% |
| Maximum | 11.9% | 22.4% |
| Range | 11.2% | 21.9% |
| Mean | 5.8% | 5.8% |
| Median | 5.9% | 4.8% |
| Interquartile 25% (IQ1) | 4.5% | 3.3% |
| Interquartile 75% (IQ3) | 7.1% | 7.1% |
| Interquartile Range (IQR) | 2.6% | 3.8% |
| Standard Deviation (Sample) | 2.3% | 4.0% |
| Standard Deviation (Population) | 2.3% | 3.9% |
Similar Demographics by Female Unemployment
Demographics Similar to British West Indians by Female Unemployment
In terms of female unemployment, the demographic groups most similar to British West Indians are Immigrants from Bangladesh (6.5%, a difference of 0.19%), Immigrants from Dominica (6.5%, a difference of 0.20%), Immigrants from St. Vincent and the Grenadines (6.4%, a difference of 0.28%), Houma (6.4%, a difference of 0.73%), and Black/African American (6.5%, a difference of 0.74%).
| Demographics | Rating | Rank | Female Unemployment |
| Immigrants | Mexico | 0.0 /100 | #311 | Tragic 6.3% |
| Immigrants | Grenada | 0.0 /100 | #312 | Tragic 6.3% |
| Belizeans | 0.0 /100 | #313 | Tragic 6.3% |
| Immigrants | Ecuador | 0.0 /100 | #314 | Tragic 6.4% |
| Pueblo | 0.0 /100 | #315 | Tragic 6.4% |
| Houma | 0.0 /100 | #316 | Tragic 6.4% |
| Immigrants | St. Vincent and the Grenadines | 0.0 /100 | #317 | Tragic 6.4% |
| British West Indians | 0.0 /100 | #318 | Tragic 6.4% |
| Immigrants | Bangladesh | 0.0 /100 | #319 | Tragic 6.5% |
| Immigrants | Dominica | 0.0 /100 | #320 | Tragic 6.5% |
| Blacks/African Americans | 0.0 /100 | #321 | Tragic 6.5% |
| Vietnamese | 0.0 /100 | #322 | Tragic 6.5% |
| Immigrants | Belize | 0.0 /100 | #323 | Tragic 6.5% |
| Cheyenne | 0.0 /100 | #324 | Tragic 6.6% |
| Apache | 0.0 /100 | #325 | Tragic 6.6% |
Demographics Similar to Delaware by Female Unemployment
In terms of female unemployment, the demographic groups most similar to Delaware are Nicaraguan (5.5%, a difference of 0.010%), Brazilian (5.5%, a difference of 0.030%), Iraqi (5.5%, a difference of 0.030%), French American Indian (5.5%, a difference of 0.25%), and Immigrants from Africa (5.4%, a difference of 0.27%).
| Demographics | Rating | Rank | Female Unemployment |
| Comanche | 10.0 /100 | #216 | Poor 5.4% |
| Peruvians | 9.6 /100 | #217 | Tragic 5.4% |
| Bermudans | 9.0 /100 | #218 | Tragic 5.4% |
| South Americans | 8.6 /100 | #219 | Tragic 5.4% |
| Immigrants | Africa | 8.5 /100 | #220 | Tragic 5.4% |
| Brazilians | 7.3 /100 | #221 | Tragic 5.5% |
| Nicaraguans | 7.2 /100 | #222 | Tragic 5.5% |
| Delaware | 7.2 /100 | #223 | Tragic 5.5% |
| Iraqis | 7.1 /100 | #224 | Tragic 5.5% |
| French American Indians | 6.1 /100 | #225 | Tragic 5.5% |
| Immigrants | Peru | 5.9 /100 | #226 | Tragic 5.5% |
| Immigrants | Philippines | 5.3 /100 | #227 | Tragic 5.5% |
| Israelis | 4.8 /100 | #228 | Tragic 5.5% |
| Panamanians | 4.7 /100 | #229 | Tragic 5.5% |
| Immigrants | Uruguay | 4.7 /100 | #230 | Tragic 5.5% |