Fijian vs Australian Unemployment
COMPARE
Fijian
Australian
Unemployment
Unemployment Comparison
Fijians
Australians
5.0%
UNEMPLOYMENT
97.6/ 100
METRIC RATING
82nd/ 347
METRIC RANK
4.9%
UNEMPLOYMENT
99.2/ 100
METRIC RATING
55th/ 347
METRIC RANK
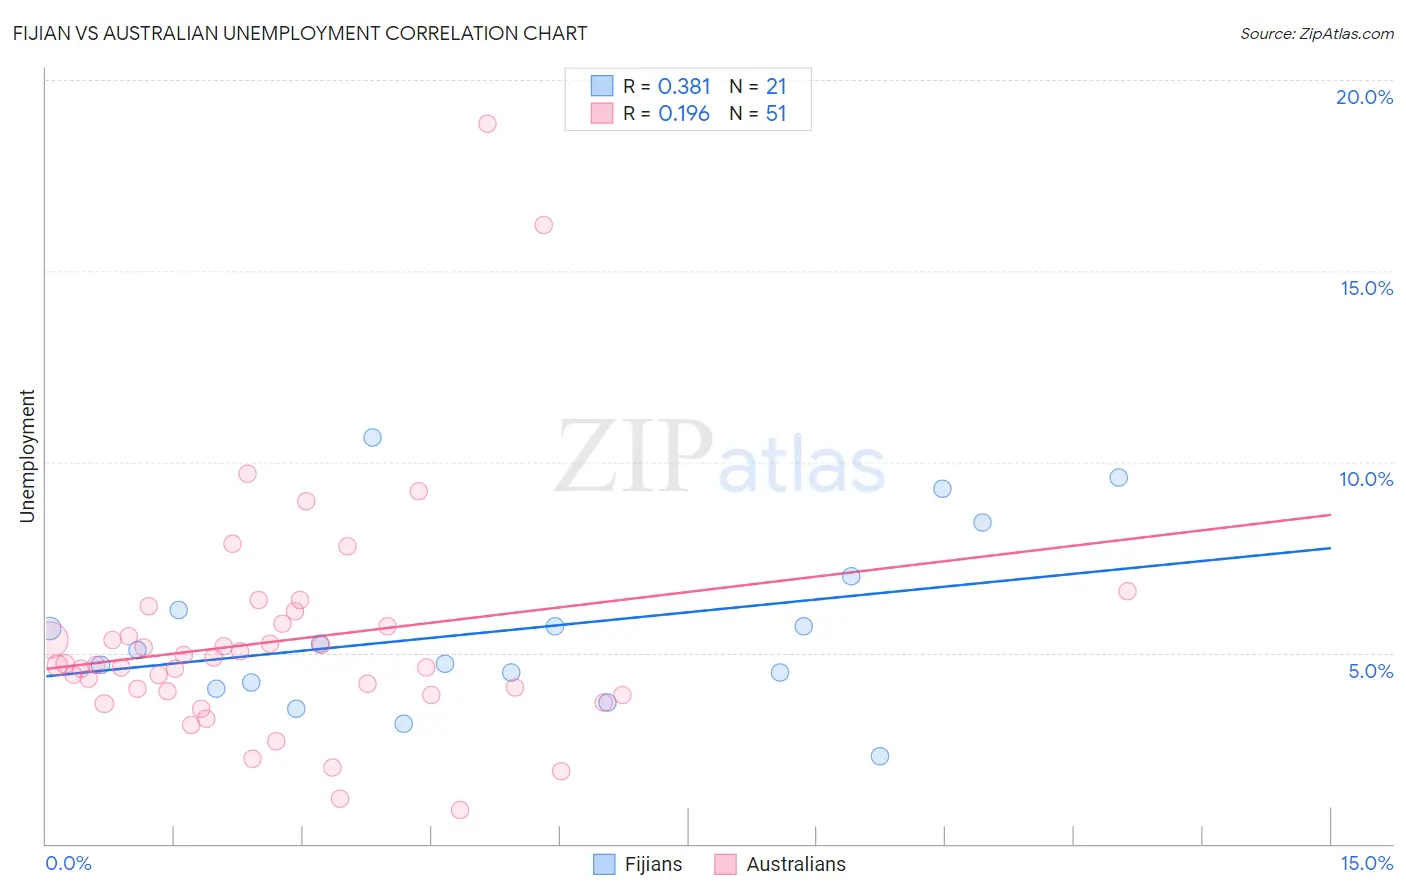
Fijian vs Australian Unemployment Correlation Chart
The statistical analysis conducted on geographies consisting of 55,931,908 people shows a mild positive correlation between the proportion of Fijians and unemployment in the United States with a correlation coefficient (R) of 0.381 and weighted average of 5.0%. Similarly, the statistical analysis conducted on geographies consisting of 224,052,970 people shows a poor positive correlation between the proportion of Australians and unemployment in the United States with a correlation coefficient (R) of 0.196 and weighted average of 4.9%, a difference of 1.8%.
Unemployment Correlation Summary
| Measurement | Fijian | Australian |
| Minimum | 2.3% | 0.90% |
| Maximum | 10.6% | 18.9% |
| Range | 8.3% | 18.0% |
| Mean | 5.6% | 5.3% |
| Median | 5.1% | 4.7% |
| Interquartile 25% (IQ1) | 4.1% | 3.9% |
| Interquartile 75% (IQ3) | 6.6% | 5.8% |
| Interquartile Range (IQR) | 2.4% | 1.9% |
| Standard Deviation (Sample) | 2.2% | 3.1% |
| Standard Deviation (Population) | 2.2% | 3.1% |
Similar Demographics by Unemployment
Demographics Similar to Fijians by Unemployment
In terms of unemployment, the demographic groups most similar to Fijians are Basque (5.0%, a difference of 0.010%), Hmong (5.0%, a difference of 0.010%), Immigrants from Sweden (5.0%, a difference of 0.020%), Canadian (5.0%, a difference of 0.090%), and Russian (5.0%, a difference of 0.090%).
| Demographics | Rating | Rank | Unemployment |
| Turks | 98.0 /100 | #75 | Exceptional 4.9% |
| German Russians | 98.0 /100 | #76 | Exceptional 4.9% |
| Cypriots | 97.9 /100 | #77 | Exceptional 4.9% |
| Okinawans | 97.9 /100 | #78 | Exceptional 4.9% |
| Canadians | 97.7 /100 | #79 | Exceptional 5.0% |
| Immigrants | Sweden | 97.6 /100 | #80 | Exceptional 5.0% |
| Basques | 97.6 /100 | #81 | Exceptional 5.0% |
| Fijians | 97.6 /100 | #82 | Exceptional 5.0% |
| Hmong | 97.6 /100 | #83 | Exceptional 5.0% |
| Russians | 97.4 /100 | #84 | Exceptional 5.0% |
| Immigrants | Australia | 97.0 /100 | #85 | Exceptional 5.0% |
| Hungarians | 96.9 /100 | #86 | Exceptional 5.0% |
| Immigrants | Moldova | 96.6 /100 | #87 | Exceptional 5.0% |
| Immigrants | Korea | 96.6 /100 | #88 | Exceptional 5.0% |
| Jordanians | 96.4 /100 | #89 | Exceptional 5.0% |
Demographics Similar to Australians by Unemployment
In terms of unemployment, the demographic groups most similar to Australians are Eastern European (4.9%, a difference of 0.030%), Immigrants from Zimbabwe (4.9%, a difference of 0.060%), White/Caucasian (4.9%, a difference of 0.090%), Immigrants from Belgium (4.9%, a difference of 0.10%), and Celtic (4.9%, a difference of 0.16%).
| Demographics | Rating | Rank | Unemployment |
| Immigrants | Scotland | 99.3 /100 | #48 | Exceptional 4.9% |
| Immigrants | South Central Asia | 99.3 /100 | #49 | Exceptional 4.9% |
| French Canadians | 99.3 /100 | #50 | Exceptional 4.9% |
| Immigrants | Belgium | 99.2 /100 | #51 | Exceptional 4.9% |
| Whites/Caucasians | 99.2 /100 | #52 | Exceptional 4.9% |
| Immigrants | Zimbabwe | 99.2 /100 | #53 | Exceptional 4.9% |
| Eastern Europeans | 99.2 /100 | #54 | Exceptional 4.9% |
| Australians | 99.2 /100 | #55 | Exceptional 4.9% |
| Celtics | 99.1 /100 | #56 | Exceptional 4.9% |
| Immigrants | Singapore | 99.1 /100 | #57 | Exceptional 4.9% |
| Greeks | 99.0 /100 | #58 | Exceptional 4.9% |
| Bhutanese | 99.0 /100 | #59 | Exceptional 4.9% |
| Immigrants | Netherlands | 99.0 /100 | #60 | Exceptional 4.9% |
| Cambodians | 99.0 /100 | #61 | Exceptional 4.9% |
| Icelanders | 98.9 /100 | #62 | Exceptional 4.9% |