Fijian vs Ukrainian Male Unemployment
COMPARE
Fijian
Ukrainian
Male Unemployment
Male Unemployment Comparison
Fijians
Ukrainians
5.2%
MALE UNEMPLOYMENT
78.3/ 100
METRIC RATING
142nd/ 347
METRIC RANK
5.1%
MALE UNEMPLOYMENT
88.4/ 100
METRIC RATING
120th/ 347
METRIC RANK
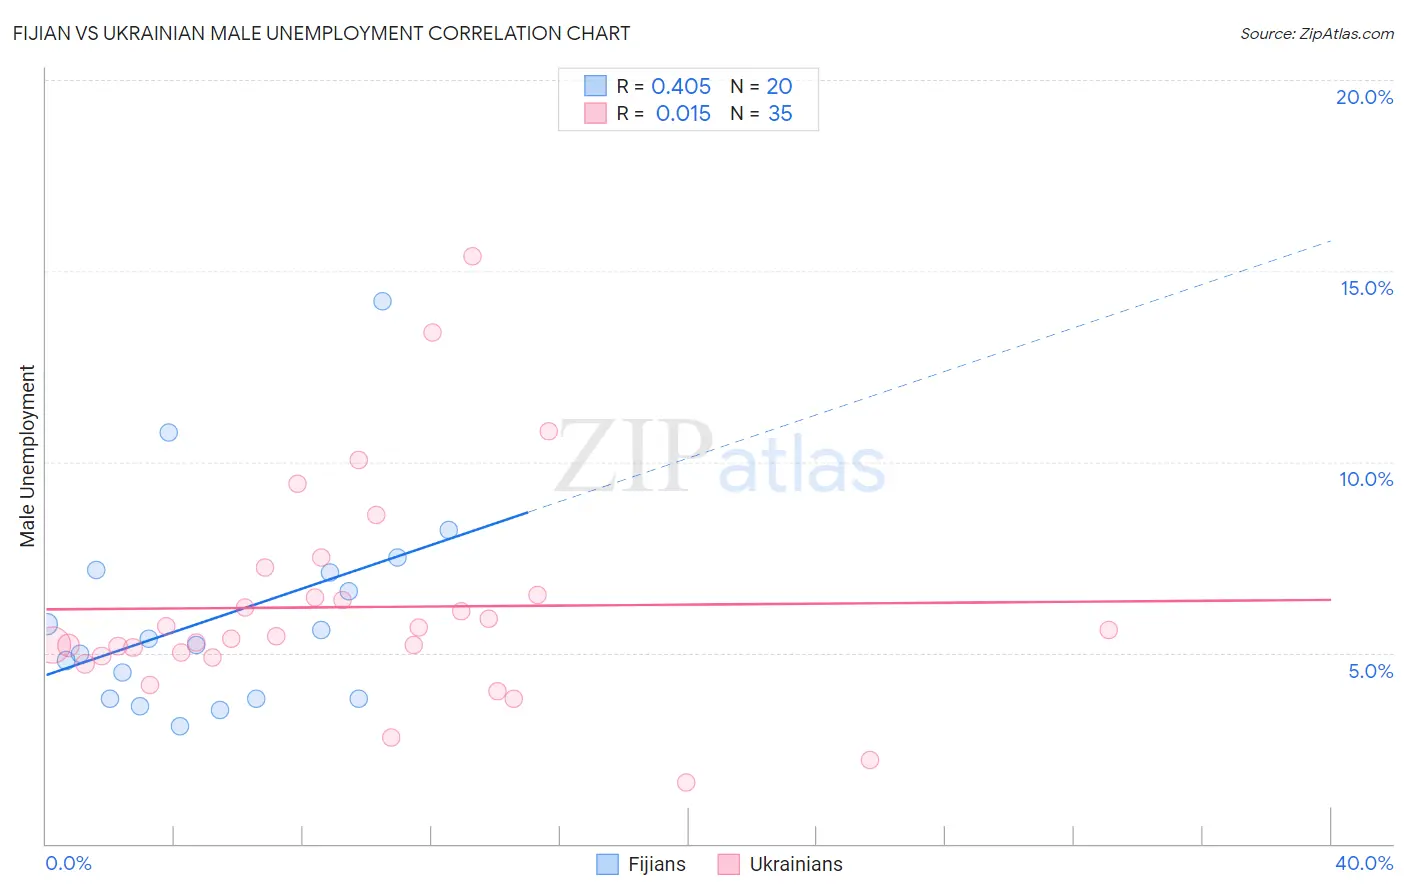
Fijian vs Ukrainian Male Unemployment Correlation Chart
The statistical analysis conducted on geographies consisting of 55,914,259 people shows a moderate positive correlation between the proportion of Fijians and unemployment rate among males in the United States with a correlation coefficient (R) of 0.405 and weighted average of 5.2%. Similarly, the statistical analysis conducted on geographies consisting of 445,622,080 people shows no correlation between the proportion of Ukrainians and unemployment rate among males in the United States with a correlation coefficient (R) of 0.015 and weighted average of 5.1%, a difference of 1.1%.
Male Unemployment Correlation Summary
| Measurement | Fijian | Ukrainian |
| Minimum | 3.1% | 1.6% |
| Maximum | 14.2% | 15.4% |
| Range | 11.1% | 13.8% |
| Mean | 6.0% | 6.2% |
| Median | 5.3% | 5.4% |
| Interquartile 25% (IQ1) | 3.8% | 4.9% |
| Interquartile 75% (IQ3) | 7.1% | 6.5% |
| Interquartile Range (IQR) | 3.3% | 1.6% |
| Standard Deviation (Sample) | 2.7% | 2.8% |
| Standard Deviation (Population) | 2.7% | 2.8% |
Similar Demographics by Male Unemployment
Demographics Similar to Fijians by Male Unemployment
In terms of male unemployment, the demographic groups most similar to Fijians are Syrian (5.2%, a difference of 0.030%), Sri Lankan (5.2%, a difference of 0.030%), Macedonian (5.2%, a difference of 0.050%), Immigrants from Kenya (5.2%, a difference of 0.050%), and Immigrants from Burma/Myanmar (5.2%, a difference of 0.070%).
| Demographics | Rating | Rank | Male Unemployment |
| Immigrants | Saudi Arabia | 80.1 /100 | #135 | Excellent 5.2% |
| Lebanese | 79.9 /100 | #136 | Good 5.2% |
| Immigrants | Eastern Africa | 79.8 /100 | #137 | Good 5.2% |
| Immigrants | Croatia | 79.7 /100 | #138 | Good 5.2% |
| Kenyans | 79.4 /100 | #139 | Good 5.2% |
| Brazilians | 79.3 /100 | #140 | Good 5.2% |
| Immigrants | Switzerland | 79.2 /100 | #141 | Good 5.2% |
| Fijians | 78.3 /100 | #142 | Good 5.2% |
| Syrians | 78.0 /100 | #143 | Good 5.2% |
| Sri Lankans | 77.9 /100 | #144 | Good 5.2% |
| Macedonians | 77.7 /100 | #145 | Good 5.2% |
| Immigrants | Kenya | 77.6 /100 | #146 | Good 5.2% |
| Immigrants | Burma/Myanmar | 77.5 /100 | #147 | Good 5.2% |
| Immigrants | Italy | 76.3 /100 | #148 | Good 5.2% |
| Immigrants | Europe | 76.2 /100 | #149 | Good 5.2% |
Demographics Similar to Ukrainians by Male Unemployment
In terms of male unemployment, the demographic groups most similar to Ukrainians are Mongolian (5.1%, a difference of 0.010%), French Canadian (5.1%, a difference of 0.020%), Nicaraguan (5.1%, a difference of 0.040%), Cypriot (5.1%, a difference of 0.060%), and Estonian (5.1%, a difference of 0.090%).
| Demographics | Rating | Rank | Male Unemployment |
| Immigrants | Austria | 90.3 /100 | #113 | Exceptional 5.1% |
| Romanians | 89.8 /100 | #114 | Excellent 5.1% |
| Immigrants | Asia | 89.6 /100 | #115 | Excellent 5.1% |
| Immigrants | Denmark | 89.4 /100 | #116 | Excellent 5.1% |
| Estonians | 89.0 /100 | #117 | Excellent 5.1% |
| Cypriots | 88.8 /100 | #118 | Excellent 5.1% |
| French Canadians | 88.6 /100 | #119 | Excellent 5.1% |
| Ukrainians | 88.4 /100 | #120 | Excellent 5.1% |
| Mongolians | 88.4 /100 | #121 | Excellent 5.1% |
| Nicaraguans | 88.2 /100 | #122 | Excellent 5.1% |
| Palestinians | 87.7 /100 | #123 | Excellent 5.1% |
| Immigrants | Latvia | 87.5 /100 | #124 | Excellent 5.1% |
| Immigrants | Lithuania | 87.2 /100 | #125 | Excellent 5.1% |
| Immigrants | Colombia | 86.8 /100 | #126 | Excellent 5.1% |
| Immigrants | Brazil | 86.3 /100 | #127 | Excellent 5.2% |