European vs Spanish American Male Unemployment
COMPARE
European
Spanish American
Male Unemployment
Male Unemployment Comparison
Europeans
Spanish Americans
4.8%
MALE UNEMPLOYMENT
99.9/ 100
METRIC RATING
19th/ 347
METRIC RANK
5.7%
MALE UNEMPLOYMENT
0.3/ 100
METRIC RATING
251st/ 347
METRIC RANK
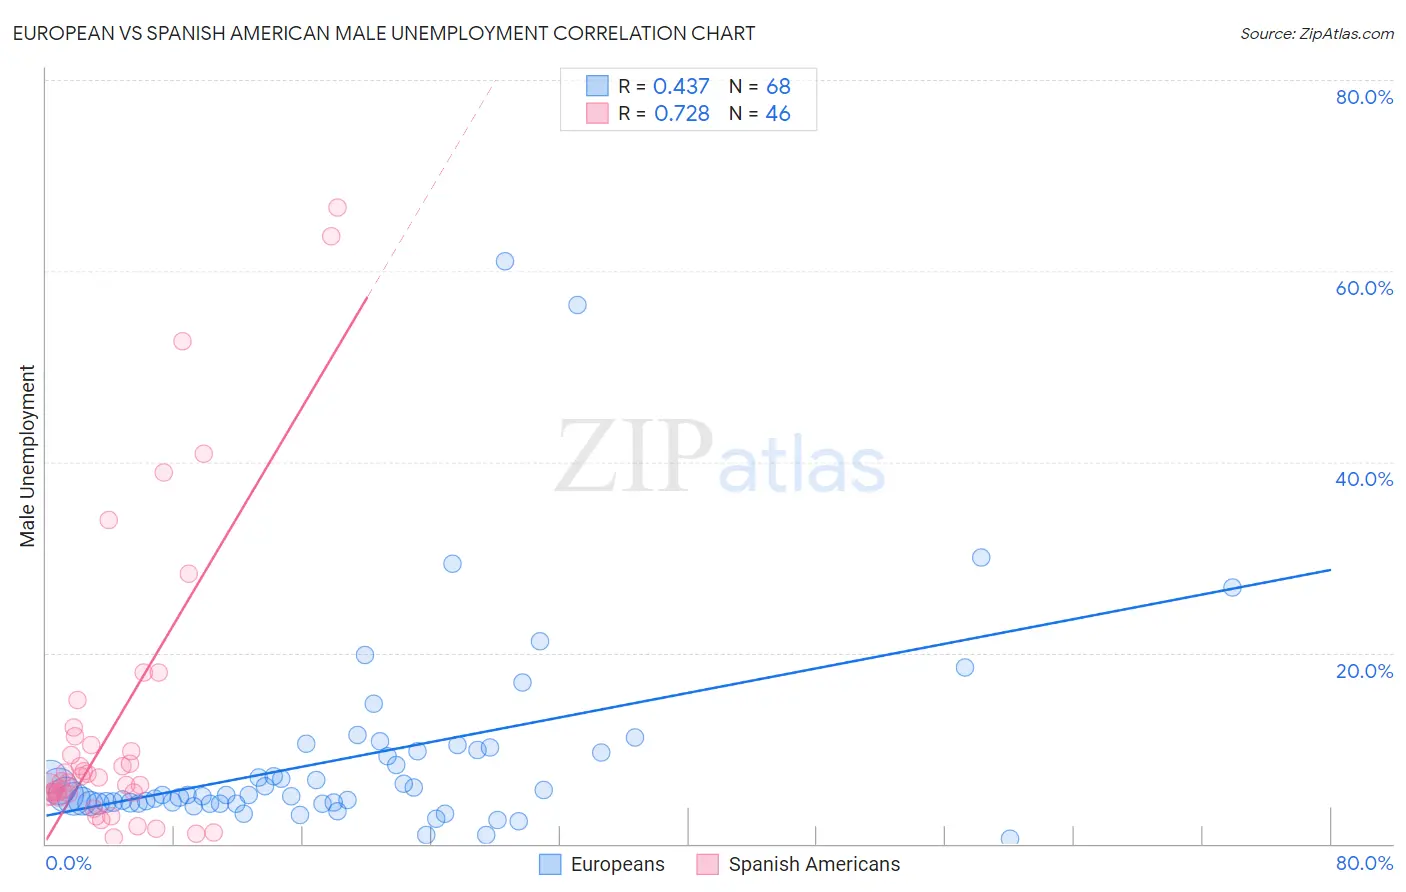
European vs Spanish American Male Unemployment Correlation Chart
The statistical analysis conducted on geographies consisting of 552,402,688 people shows a moderate positive correlation between the proportion of Europeans and unemployment rate among males in the United States with a correlation coefficient (R) of 0.437 and weighted average of 4.8%. Similarly, the statistical analysis conducted on geographies consisting of 103,047,873 people shows a strong positive correlation between the proportion of Spanish Americans and unemployment rate among males in the United States with a correlation coefficient (R) of 0.728 and weighted average of 5.7%, a difference of 20.5%.
Male Unemployment Correlation Summary
| Measurement | European | Spanish American |
| Minimum | 0.50% | 0.60% |
| Maximum | 61.0% | 66.7% |
| Range | 60.5% | 66.1% |
| Mean | 9.0% | 12.8% |
| Median | 5.1% | 6.7% |
| Interquartile 25% (IQ1) | 4.2% | 5.2% |
| Interquartile 75% (IQ3) | 9.7% | 11.3% |
| Interquartile Range (IQR) | 5.5% | 6.1% |
| Standard Deviation (Sample) | 10.7% | 15.8% |
| Standard Deviation (Population) | 10.6% | 15.7% |
Similar Demographics by Male Unemployment
Demographics Similar to Europeans by Male Unemployment
In terms of male unemployment, the demographic groups most similar to Europeans are English (4.8%, a difference of 0.030%), Pennsylvania German (4.8%, a difference of 0.050%), Immigrants from Taiwan (4.8%, a difference of 0.22%), Carpatho Rusyn (4.8%, a difference of 0.23%), and Tongan (4.8%, a difference of 0.27%).
| Demographics | Rating | Rank | Male Unemployment |
| Immigrants | Bolivia | 100.0 /100 | #12 | Exceptional 4.7% |
| Bolivians | 100.0 /100 | #13 | Exceptional 4.7% |
| Germans | 100.0 /100 | #14 | Exceptional 4.7% |
| Scandinavians | 100.0 /100 | #15 | Exceptional 4.7% |
| Swiss | 99.9 /100 | #16 | Exceptional 4.7% |
| Filipinos | 99.9 /100 | #17 | Exceptional 4.7% |
| English | 99.9 /100 | #18 | Exceptional 4.8% |
| Europeans | 99.9 /100 | #19 | Exceptional 4.8% |
| Pennsylvania Germans | 99.9 /100 | #20 | Exceptional 4.8% |
| Immigrants | Taiwan | 99.9 /100 | #21 | Exceptional 4.8% |
| Carpatho Rusyns | 99.9 /100 | #22 | Exceptional 4.8% |
| Tongans | 99.9 /100 | #23 | Exceptional 4.8% |
| Immigrants | South Central Asia | 99.9 /100 | #24 | Exceptional 4.8% |
| Zimbabweans | 99.9 /100 | #25 | Exceptional 4.8% |
| Dutch | 99.9 /100 | #26 | Exceptional 4.8% |
Demographics Similar to Spanish Americans by Male Unemployment
In terms of male unemployment, the demographic groups most similar to Spanish Americans are Immigrants from Bahamas (5.7%, a difference of 0.040%), Cree (5.7%, a difference of 0.29%), Marshallese (5.7%, a difference of 0.36%), Mexican (5.8%, a difference of 0.57%), and Hawaiian (5.7%, a difference of 0.68%).
| Demographics | Rating | Rank | Male Unemployment |
| Immigrants | El Salvador | 0.7 /100 | #244 | Tragic 5.7% |
| Yaqui | 0.7 /100 | #245 | Tragic 5.7% |
| Iroquois | 0.6 /100 | #246 | Tragic 5.7% |
| Hawaiians | 0.6 /100 | #247 | Tragic 5.7% |
| Marshallese | 0.5 /100 | #248 | Tragic 5.7% |
| Cree | 0.4 /100 | #249 | Tragic 5.7% |
| Immigrants | Bahamas | 0.4 /100 | #250 | Tragic 5.7% |
| Spanish Americans | 0.3 /100 | #251 | Tragic 5.7% |
| Mexicans | 0.2 /100 | #252 | Tragic 5.8% |
| Mexican American Indians | 0.2 /100 | #253 | Tragic 5.8% |
| Japanese | 0.2 /100 | #254 | Tragic 5.8% |
| Kiowa | 0.2 /100 | #255 | Tragic 5.8% |
| Comanche | 0.2 /100 | #256 | Tragic 5.8% |
| Hispanics or Latinos | 0.1 /100 | #257 | Tragic 5.8% |
| Dutch West Indians | 0.1 /100 | #258 | Tragic 5.8% |