Immigrants from Nicaragua vs Spaniard Female Unemployment
COMPARE
Immigrants from Nicaragua
Spaniard
Female Unemployment
Female Unemployment Comparison
Immigrants from Nicaragua
Spaniards
5.4%
FEMALE UNEMPLOYMENT
10.2/ 100
METRIC RATING
215th/ 347
METRIC RANK
5.3%
FEMALE UNEMPLOYMENT
25.2/ 100
METRIC RATING
196th/ 347
METRIC RANK
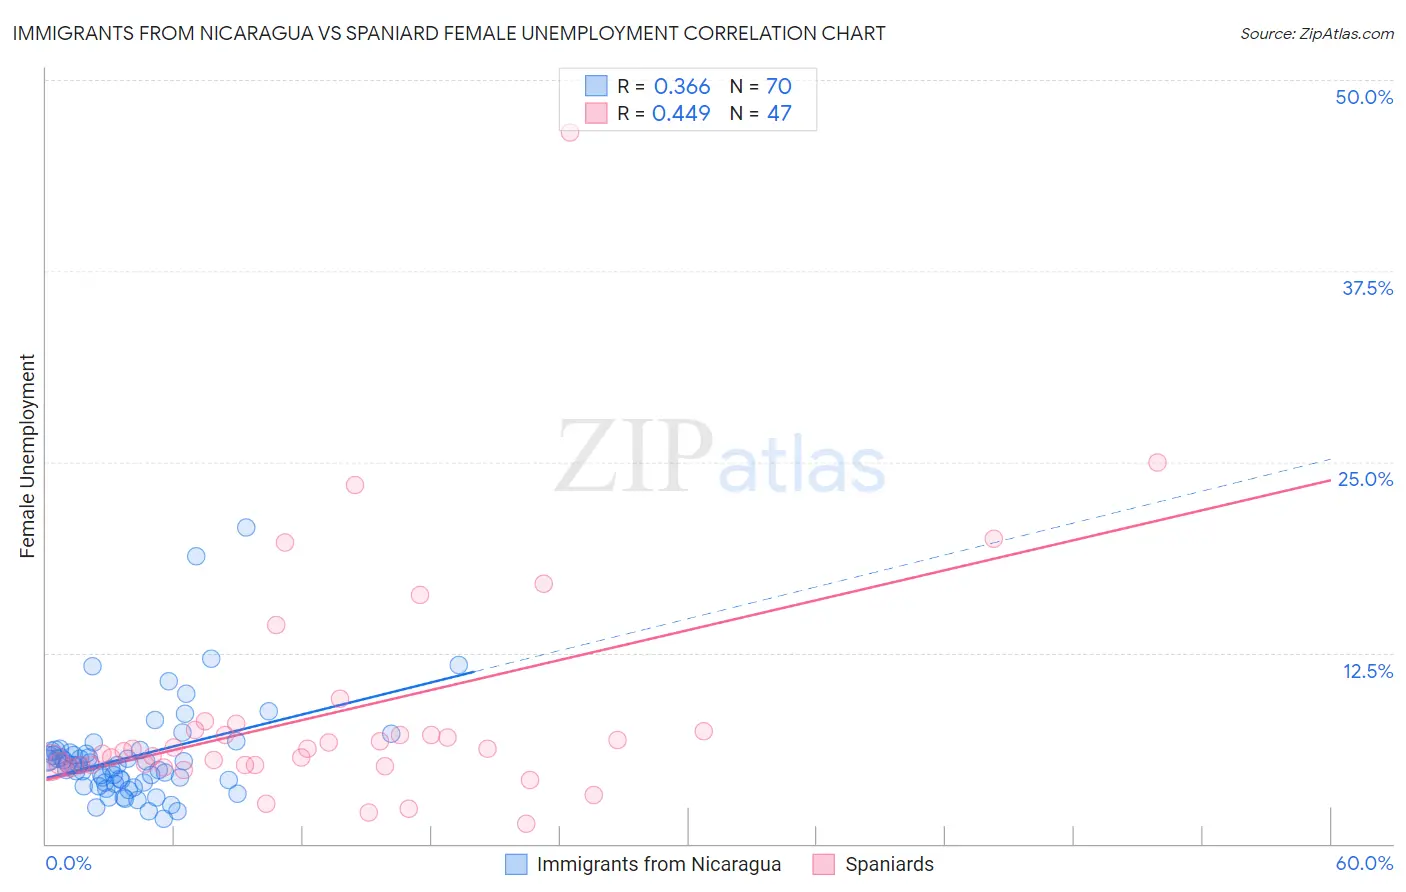
Immigrants from Nicaragua vs Spaniard Female Unemployment Correlation Chart
The statistical analysis conducted on geographies consisting of 235,945,164 people shows a mild positive correlation between the proportion of Immigrants from Nicaragua and unemploymnet rate among females in the United States with a correlation coefficient (R) of 0.366 and weighted average of 5.4%. Similarly, the statistical analysis conducted on geographies consisting of 440,755,407 people shows a moderate positive correlation between the proportion of Spaniards and unemploymnet rate among females in the United States with a correlation coefficient (R) of 0.449 and weighted average of 5.3%, a difference of 1.6%.
Female Unemployment Correlation Summary
| Measurement | Immigrants from Nicaragua | Spaniard |
| Minimum | 1.6% | 1.3% |
| Maximum | 20.7% | 46.6% |
| Range | 19.1% | 45.3% |
| Mean | 5.7% | 8.6% |
| Median | 5.1% | 6.2% |
| Interquartile 25% (IQ1) | 4.0% | 5.2% |
| Interquartile 75% (IQ3) | 6.0% | 7.4% |
| Interquartile Range (IQR) | 2.0% | 2.2% |
| Standard Deviation (Sample) | 3.3% | 7.8% |
| Standard Deviation (Population) | 3.2% | 7.7% |
Demographics Similar to Immigrants from Nicaragua and Spaniards by Female Unemployment
In terms of female unemployment, the demographic groups most similar to Immigrants from Nicaragua are Seminole (5.4%, a difference of 0.020%), Samoan (5.4%, a difference of 0.070%), Uruguayan (5.4%, a difference of 0.19%), Ottawa (5.4%, a difference of 0.21%), and Choctaw (5.4%, a difference of 0.30%). Similarly, the demographic groups most similar to Spaniards are Immigrants from Colombia (5.3%, a difference of 0.080%), Alsatian (5.3%, a difference of 0.10%), Tsimshian (5.4%, a difference of 0.17%), Hawaiian (5.4%, a difference of 0.25%), and Soviet Union (5.4%, a difference of 0.29%).
| Demographics | Rating | Rank | Female Unemployment |
| Immigrants | Colombia | 26.2 /100 | #195 | Fair 5.3% |
| Spaniards | 25.2 /100 | #196 | Fair 5.3% |
| Alsatians | 23.9 /100 | #197 | Fair 5.3% |
| Tsimshian | 23.1 /100 | #198 | Fair 5.4% |
| Hawaiians | 22.2 /100 | #199 | Fair 5.4% |
| Soviet Union | 21.7 /100 | #200 | Fair 5.4% |
| Immigrants | Middle Africa | 20.8 /100 | #201 | Fair 5.4% |
| Iroquois | 20.8 /100 | #202 | Fair 5.4% |
| Immigrants | South Eastern Asia | 20.3 /100 | #203 | Fair 5.4% |
| Immigrants | Israel | 19.7 /100 | #204 | Poor 5.4% |
| Immigrants | Afghanistan | 18.9 /100 | #205 | Poor 5.4% |
| Immigrants | Brazil | 18.8 /100 | #206 | Poor 5.4% |
| Creek | 15.4 /100 | #207 | Poor 5.4% |
| Immigrants | Costa Rica | 13.7 /100 | #208 | Poor 5.4% |
| Koreans | 13.4 /100 | #209 | Poor 5.4% |
| Choctaw | 12.3 /100 | #210 | Poor 5.4% |
| Ottawa | 11.6 /100 | #211 | Poor 5.4% |
| Uruguayans | 11.4 /100 | #212 | Poor 5.4% |
| Samoans | 10.6 /100 | #213 | Poor 5.4% |
| Seminole | 10.3 /100 | #214 | Poor 5.4% |
| Immigrants | Nicaragua | 10.2 /100 | #215 | Poor 5.4% |