Estonian vs Irish Unemployment Among Seniors over 75 years
COMPARE
Estonian
Irish
Unemployment Among Seniors over 75 years
Unemployment Among Seniors over 75 years Comparison
Estonians
Irish
8.8%
UNEMPLOYMENT AMONG SENIORS OVER 75 YEARS
33.3/ 100
METRIC RATING
191st/ 347
METRIC RANK
10.2%
UNEMPLOYMENT AMONG SENIORS OVER 75 YEARS
0.0/ 100
METRIC RATING
317th/ 347
METRIC RANK
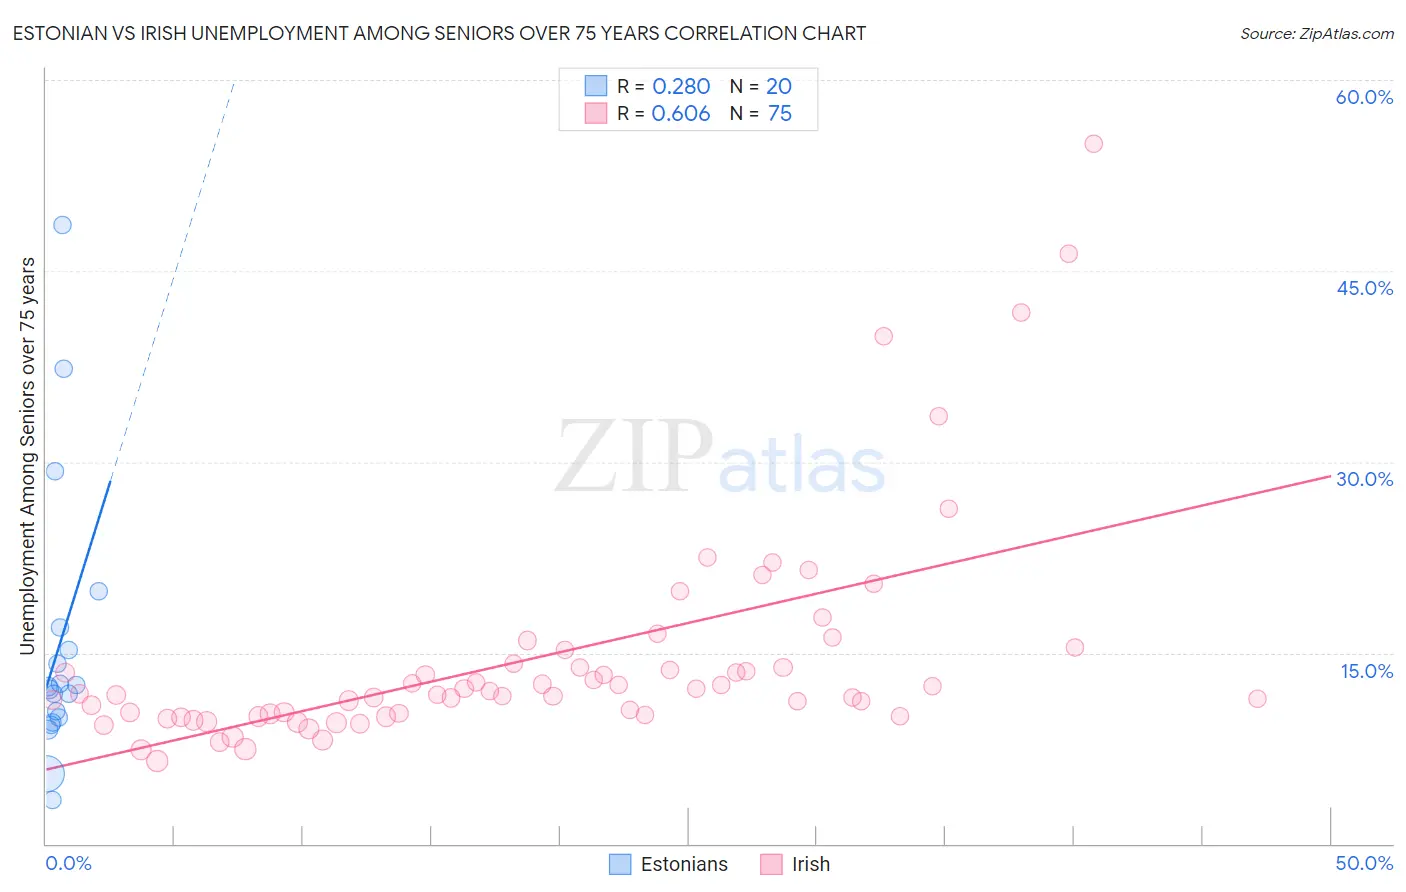
Estonian vs Irish Unemployment Among Seniors over 75 years Correlation Chart
The statistical analysis conducted on geographies consisting of 88,437,041 people shows a weak positive correlation between the proportion of Estonians and unemployment rate among seniors over the age of 75 in the United States with a correlation coefficient (R) of 0.280 and weighted average of 8.8%. Similarly, the statistical analysis conducted on geographies consisting of 235,224,616 people shows a significant positive correlation between the proportion of Irish and unemployment rate among seniors over the age of 75 in the United States with a correlation coefficient (R) of 0.606 and weighted average of 10.2%, a difference of 15.9%.
Unemployment Among Seniors over 75 years Correlation Summary
| Measurement | Estonian | Irish |
| Minimum | 3.5% | 6.5% |
| Maximum | 48.6% | 55.0% |
| Range | 45.1% | 48.5% |
| Mean | 15.6% | 14.6% |
| Median | 12.2% | 11.8% |
| Interquartile 25% (IQ1) | 9.7% | 10.1% |
| Interquartile 75% (IQ3) | 16.1% | 14.1% |
| Interquartile Range (IQR) | 6.4% | 4.0% |
| Standard Deviation (Sample) | 10.9% | 8.8% |
| Standard Deviation (Population) | 10.6% | 8.7% |
Similar Demographics by Unemployment Among Seniors over 75 years
Demographics Similar to Estonians by Unemployment Among Seniors over 75 years
In terms of unemployment among seniors over 75 years, the demographic groups most similar to Estonians are Mexican American Indian (8.8%, a difference of 0.080%), Immigrants from Eastern Europe (8.8%, a difference of 0.090%), Immigrants from Haiti (8.8%, a difference of 0.090%), Immigrants from Kenya (8.8%, a difference of 0.090%), and Immigrants from Europe (8.8%, a difference of 0.12%).
| Demographics | Rating | Rank | Unemployment Among Seniors over 75 years |
| Immigrants | Micronesia | 37.2 /100 | #184 | Fair 8.8% |
| Choctaw | 37.1 /100 | #185 | Fair 8.8% |
| Immigrants | Ethiopia | 36.2 /100 | #186 | Fair 8.8% |
| Immigrants | Europe | 35.2 /100 | #187 | Fair 8.8% |
| Immigrants | Eastern Europe | 34.7 /100 | #188 | Fair 8.8% |
| Immigrants | Haiti | 34.7 /100 | #189 | Fair 8.8% |
| Mexican American Indians | 34.7 /100 | #190 | Fair 8.8% |
| Estonians | 33.3 /100 | #191 | Fair 8.8% |
| Immigrants | Kenya | 31.8 /100 | #192 | Fair 8.8% |
| Immigrants | Guyana | 29.9 /100 | #193 | Fair 8.8% |
| Maltese | 29.2 /100 | #194 | Fair 8.8% |
| Okinawans | 28.9 /100 | #195 | Fair 8.8% |
| Immigrants | Jamaica | 27.7 /100 | #196 | Fair 8.9% |
| Immigrants | Laos | 26.3 /100 | #197 | Fair 8.9% |
| Eastern Europeans | 25.9 /100 | #198 | Fair 8.9% |
Demographics Similar to Irish by Unemployment Among Seniors over 75 years
In terms of unemployment among seniors over 75 years, the demographic groups most similar to Irish are Liberian (10.2%, a difference of 0.12%), German (10.3%, a difference of 0.20%), Native/Alaskan (10.2%, a difference of 0.37%), French (10.3%, a difference of 0.42%), and Aleut (10.3%, a difference of 0.43%).
| Demographics | Rating | Rank | Unemployment Among Seniors over 75 years |
| Hungarians | 0.0 /100 | #310 | Tragic 10.1% |
| Scottish | 0.0 /100 | #311 | Tragic 10.1% |
| Chippewa | 0.0 /100 | #312 | Tragic 10.1% |
| Nepalese | 0.0 /100 | #313 | Tragic 10.1% |
| Dutch West Indians | 0.0 /100 | #314 | Tragic 10.2% |
| Pennsylvania Germans | 0.0 /100 | #315 | Tragic 10.2% |
| Natives/Alaskans | 0.0 /100 | #316 | Tragic 10.2% |
| Irish | 0.0 /100 | #317 | Tragic 10.2% |
| Liberians | 0.0 /100 | #318 | Tragic 10.2% |
| Germans | 0.0 /100 | #319 | Tragic 10.3% |
| French | 0.0 /100 | #320 | Tragic 10.3% |
| Aleuts | 0.0 /100 | #321 | Tragic 10.3% |
| Poles | 0.0 /100 | #322 | Tragic 10.3% |
| Tongans | 0.0 /100 | #323 | Tragic 10.4% |
| Americans | 0.0 /100 | #324 | Tragic 10.4% |