English vs Immigrants from Uruguay Male Unemployment
COMPARE
English
Immigrants from Uruguay
Male Unemployment
Male Unemployment Comparison
English
Immigrants from Uruguay
4.8%
MALE UNEMPLOYMENT
99.9/ 100
METRIC RATING
18th/ 347
METRIC RANK
5.2%
MALE UNEMPLOYMENT
73.9/ 100
METRIC RATING
153rd/ 347
METRIC RANK
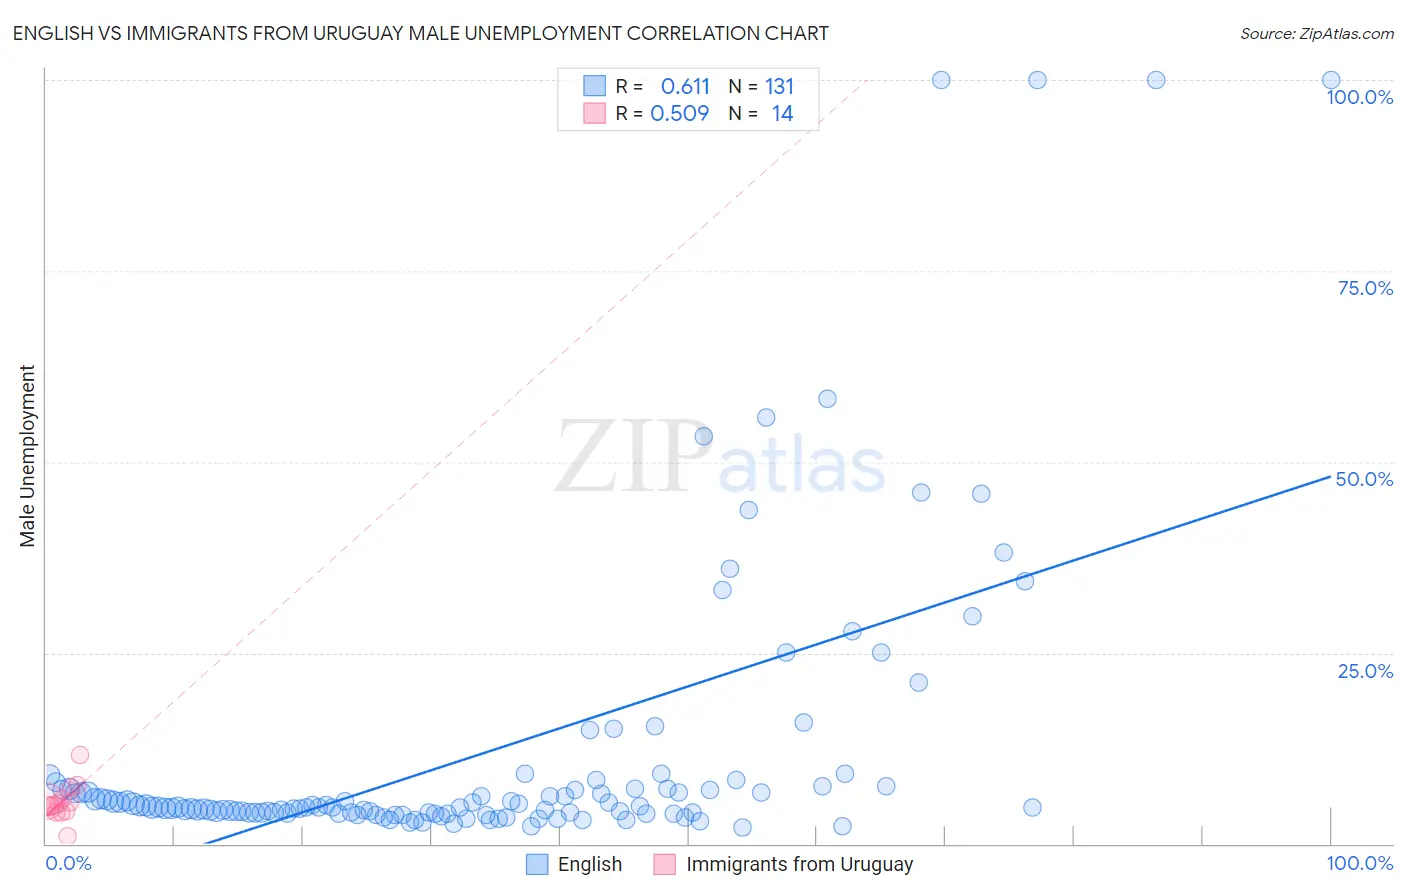
English vs Immigrants from Uruguay Male Unemployment Correlation Chart
The statistical analysis conducted on geographies consisting of 566,278,117 people shows a significant positive correlation between the proportion of English and unemployment rate among males in the United States with a correlation coefficient (R) of 0.611 and weighted average of 4.8%. Similarly, the statistical analysis conducted on geographies consisting of 133,186,426 people shows a substantial positive correlation between the proportion of Immigrants from Uruguay and unemployment rate among males in the United States with a correlation coefficient (R) of 0.509 and weighted average of 5.2%, a difference of 9.6%.
Male Unemployment Correlation Summary
| Measurement | English | Immigrants from Uruguay |
| Minimum | 2.2% | 1.0% |
| Maximum | 100.0% | 11.6% |
| Range | 97.8% | 10.6% |
| Mean | 12.0% | 5.5% |
| Median | 4.8% | 5.2% |
| Interquartile 25% (IQ1) | 4.0% | 4.3% |
| Interquartile 75% (IQ3) | 7.3% | 6.0% |
| Interquartile Range (IQR) | 3.2% | 1.7% |
| Standard Deviation (Sample) | 19.4% | 2.4% |
| Standard Deviation (Population) | 19.3% | 2.3% |
Similar Demographics by Male Unemployment
Demographics Similar to English by Male Unemployment
In terms of male unemployment, the demographic groups most similar to English are European (4.8%, a difference of 0.030%), Pennsylvania German (4.8%, a difference of 0.080%), Immigrants from Taiwan (4.8%, a difference of 0.24%), Carpatho Rusyn (4.8%, a difference of 0.26%), and Filipino (4.7%, a difference of 0.30%).
| Demographics | Rating | Rank | Male Unemployment |
| Swedes | 100.0 /100 | #11 | Exceptional 4.6% |
| Immigrants | Bolivia | 100.0 /100 | #12 | Exceptional 4.7% |
| Bolivians | 100.0 /100 | #13 | Exceptional 4.7% |
| Germans | 100.0 /100 | #14 | Exceptional 4.7% |
| Scandinavians | 100.0 /100 | #15 | Exceptional 4.7% |
| Swiss | 99.9 /100 | #16 | Exceptional 4.7% |
| Filipinos | 99.9 /100 | #17 | Exceptional 4.7% |
| English | 99.9 /100 | #18 | Exceptional 4.8% |
| Europeans | 99.9 /100 | #19 | Exceptional 4.8% |
| Pennsylvania Germans | 99.9 /100 | #20 | Exceptional 4.8% |
| Immigrants | Taiwan | 99.9 /100 | #21 | Exceptional 4.8% |
| Carpatho Rusyns | 99.9 /100 | #22 | Exceptional 4.8% |
| Tongans | 99.9 /100 | #23 | Exceptional 4.8% |
| Immigrants | South Central Asia | 99.9 /100 | #24 | Exceptional 4.8% |
| Zimbabweans | 99.9 /100 | #25 | Exceptional 4.8% |
Demographics Similar to Immigrants from Uruguay by Male Unemployment
In terms of male unemployment, the demographic groups most similar to Immigrants from Uruguay are Laotian (5.2%, a difference of 0.010%), Immigrants from Hungary (5.2%, a difference of 0.040%), Egyptian (5.2%, a difference of 0.070%), American (5.2%, a difference of 0.090%), and Immigrants from Northern Africa (5.2%, a difference of 0.12%).
| Demographics | Rating | Rank | Male Unemployment |
| Immigrants | Kenya | 77.6 /100 | #146 | Good 5.2% |
| Immigrants | Burma/Myanmar | 77.5 /100 | #147 | Good 5.2% |
| Immigrants | Italy | 76.3 /100 | #148 | Good 5.2% |
| Immigrants | Europe | 76.2 /100 | #149 | Good 5.2% |
| Indians (Asian) | 76.0 /100 | #150 | Good 5.2% |
| Slovaks | 75.5 /100 | #151 | Good 5.2% |
| Egyptians | 74.8 /100 | #152 | Good 5.2% |
| Immigrants | Uruguay | 73.9 /100 | #153 | Good 5.2% |
| Laotians | 73.8 /100 | #154 | Good 5.2% |
| Immigrants | Hungary | 73.4 /100 | #155 | Good 5.2% |
| Americans | 72.7 /100 | #156 | Good 5.2% |
| Immigrants | Northern Africa | 72.3 /100 | #157 | Good 5.2% |
| Immigrants | Indonesia | 71.5 /100 | #158 | Good 5.2% |
| Indonesians | 71.2 /100 | #159 | Good 5.2% |
| Immigrants | Norway | 71.0 /100 | #160 | Good 5.2% |