English vs Immigrants from Brazil Male Unemployment
COMPARE
English
Immigrants from Brazil
Male Unemployment
Male Unemployment Comparison
English
Immigrants from Brazil
4.8%
MALE UNEMPLOYMENT
99.9/ 100
METRIC RATING
18th/ 347
METRIC RANK
5.2%
MALE UNEMPLOYMENT
86.3/ 100
METRIC RATING
127th/ 347
METRIC RANK
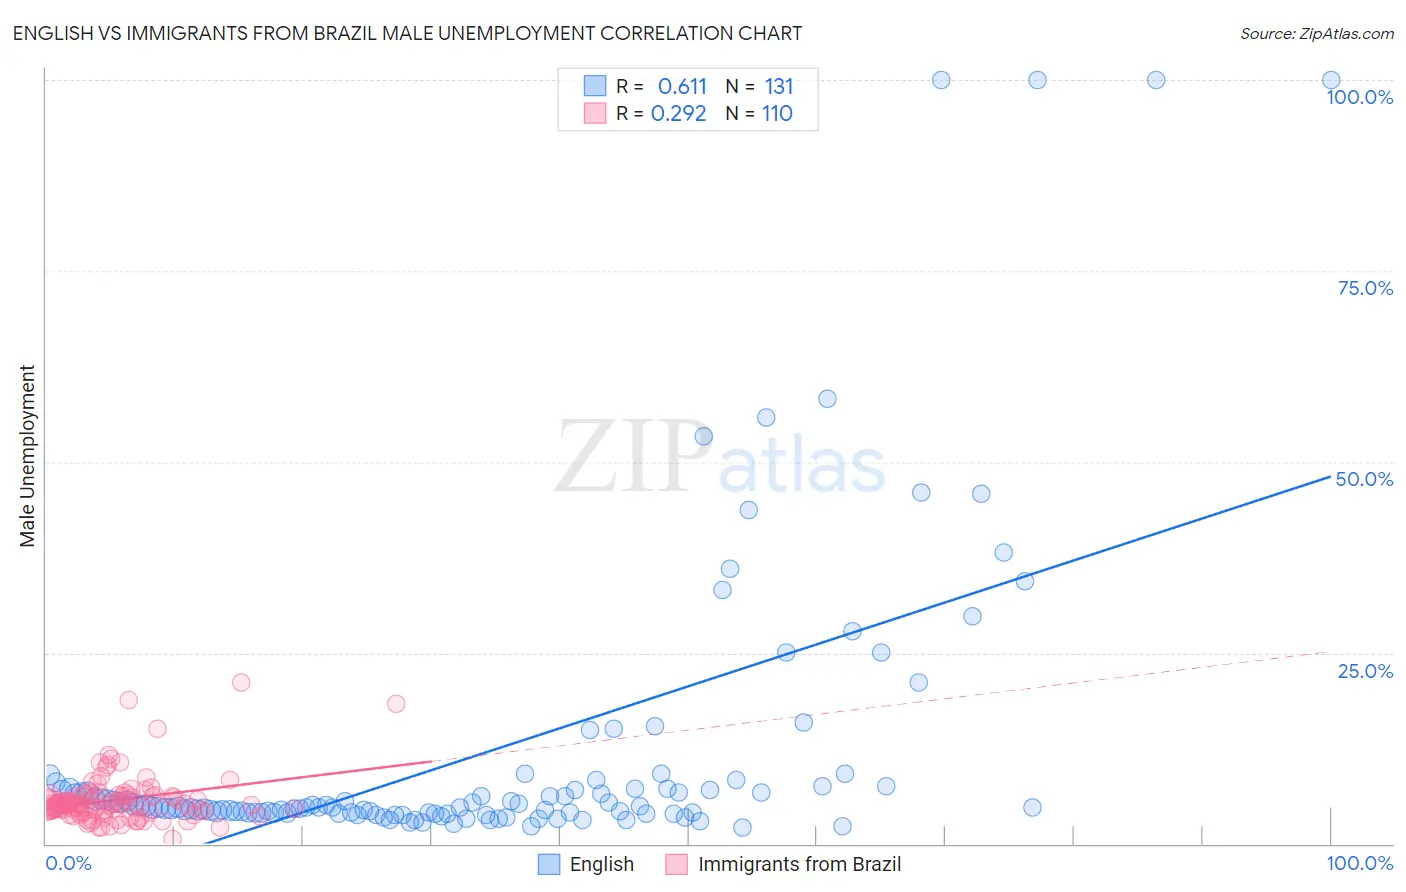
English vs Immigrants from Brazil Male Unemployment Correlation Chart
The statistical analysis conducted on geographies consisting of 566,278,117 people shows a significant positive correlation between the proportion of English and unemployment rate among males in the United States with a correlation coefficient (R) of 0.611 and weighted average of 4.8%. Similarly, the statistical analysis conducted on geographies consisting of 342,068,748 people shows a weak positive correlation between the proportion of Immigrants from Brazil and unemployment rate among males in the United States with a correlation coefficient (R) of 0.292 and weighted average of 5.2%, a difference of 8.3%.
Male Unemployment Correlation Summary
| Measurement | English | Immigrants from Brazil |
| Minimum | 2.2% | 0.60% |
| Maximum | 100.0% | 21.1% |
| Range | 97.8% | 20.5% |
| Mean | 12.0% | 5.7% |
| Median | 4.8% | 5.1% |
| Interquartile 25% (IQ1) | 4.0% | 4.1% |
| Interquartile 75% (IQ3) | 7.3% | 6.2% |
| Interquartile Range (IQR) | 3.2% | 2.1% |
| Standard Deviation (Sample) | 19.4% | 3.2% |
| Standard Deviation (Population) | 19.3% | 3.2% |
Similar Demographics by Male Unemployment
Demographics Similar to English by Male Unemployment
In terms of male unemployment, the demographic groups most similar to English are European (4.8%, a difference of 0.030%), Pennsylvania German (4.8%, a difference of 0.080%), Immigrants from Taiwan (4.8%, a difference of 0.24%), Carpatho Rusyn (4.8%, a difference of 0.26%), and Filipino (4.7%, a difference of 0.30%).
| Demographics | Rating | Rank | Male Unemployment |
| Swedes | 100.0 /100 | #11 | Exceptional 4.6% |
| Immigrants | Bolivia | 100.0 /100 | #12 | Exceptional 4.7% |
| Bolivians | 100.0 /100 | #13 | Exceptional 4.7% |
| Germans | 100.0 /100 | #14 | Exceptional 4.7% |
| Scandinavians | 100.0 /100 | #15 | Exceptional 4.7% |
| Swiss | 99.9 /100 | #16 | Exceptional 4.7% |
| Filipinos | 99.9 /100 | #17 | Exceptional 4.7% |
| English | 99.9 /100 | #18 | Exceptional 4.8% |
| Europeans | 99.9 /100 | #19 | Exceptional 4.8% |
| Pennsylvania Germans | 99.9 /100 | #20 | Exceptional 4.8% |
| Immigrants | Taiwan | 99.9 /100 | #21 | Exceptional 4.8% |
| Carpatho Rusyns | 99.9 /100 | #22 | Exceptional 4.8% |
| Tongans | 99.9 /100 | #23 | Exceptional 4.8% |
| Immigrants | South Central Asia | 99.9 /100 | #24 | Exceptional 4.8% |
| Zimbabweans | 99.9 /100 | #25 | Exceptional 4.8% |
Demographics Similar to Immigrants from Brazil by Male Unemployment
In terms of male unemployment, the demographic groups most similar to Immigrants from Brazil are Immigrants from Colombia (5.1%, a difference of 0.060%), Immigrants from Lithuania (5.1%, a difference of 0.11%), Immigrants from Latvia (5.1%, a difference of 0.15%), Hungarian (5.2%, a difference of 0.15%), and Palestinian (5.1%, a difference of 0.18%).
| Demographics | Rating | Rank | Male Unemployment |
| Ukrainians | 88.4 /100 | #120 | Excellent 5.1% |
| Mongolians | 88.4 /100 | #121 | Excellent 5.1% |
| Nicaraguans | 88.2 /100 | #122 | Excellent 5.1% |
| Palestinians | 87.7 /100 | #123 | Excellent 5.1% |
| Immigrants | Latvia | 87.5 /100 | #124 | Excellent 5.1% |
| Immigrants | Lithuania | 87.2 /100 | #125 | Excellent 5.1% |
| Immigrants | Colombia | 86.8 /100 | #126 | Excellent 5.1% |
| Immigrants | Brazil | 86.3 /100 | #127 | Excellent 5.2% |
| Hungarians | 85.1 /100 | #128 | Excellent 5.2% |
| Immigrants | Western Europe | 84.8 /100 | #129 | Excellent 5.2% |
| Immigrants | Malaysia | 83.5 /100 | #130 | Excellent 5.2% |
| Immigrants | Germany | 83.0 /100 | #131 | Excellent 5.2% |
| Chickasaw | 82.9 /100 | #132 | Excellent 5.2% |
| Colombians | 81.1 /100 | #133 | Excellent 5.2% |
| Pakistanis | 80.5 /100 | #134 | Excellent 5.2% |