English vs Immigrants from Panama Male Unemployment
COMPARE
English
Immigrants from Panama
Male Unemployment
Male Unemployment Comparison
English
Immigrants from Panama
4.8%
MALE UNEMPLOYMENT
99.9/ 100
METRIC RATING
18th/ 347
METRIC RANK
5.6%
MALE UNEMPLOYMENT
1.8/ 100
METRIC RATING
227th/ 347
METRIC RANK
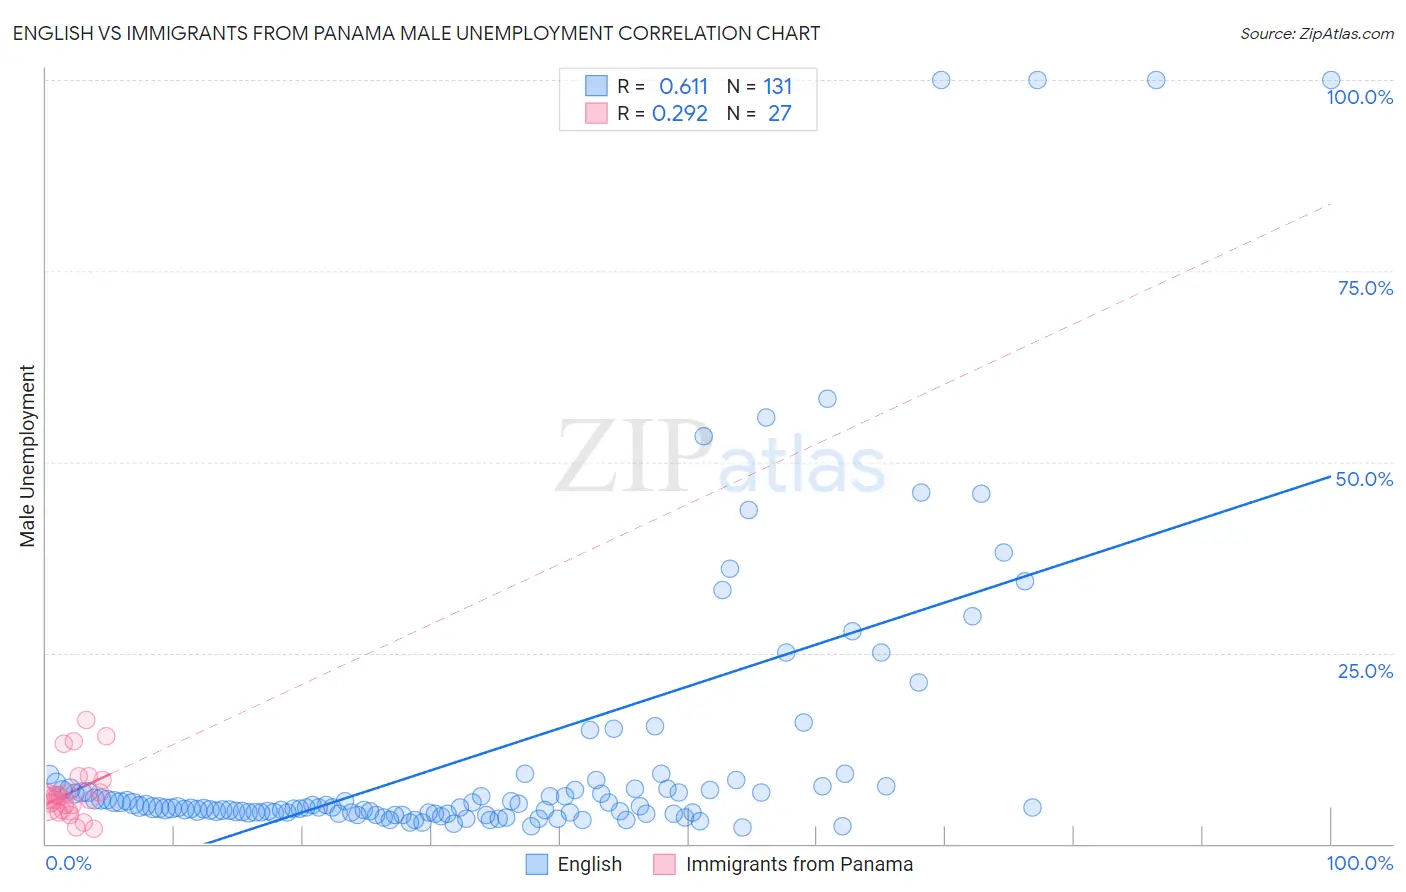
English vs Immigrants from Panama Male Unemployment Correlation Chart
The statistical analysis conducted on geographies consisting of 566,278,117 people shows a significant positive correlation between the proportion of English and unemployment rate among males in the United States with a correlation coefficient (R) of 0.611 and weighted average of 4.8%. Similarly, the statistical analysis conducted on geographies consisting of 220,860,103 people shows a weak positive correlation between the proportion of Immigrants from Panama and unemployment rate among males in the United States with a correlation coefficient (R) of 0.292 and weighted average of 5.6%, a difference of 17.8%.
Male Unemployment Correlation Summary
| Measurement | English | Immigrants from Panama |
| Minimum | 2.2% | 1.9% |
| Maximum | 100.0% | 16.2% |
| Range | 97.8% | 14.3% |
| Mean | 12.0% | 6.8% |
| Median | 4.8% | 5.8% |
| Interquartile 25% (IQ1) | 4.0% | 4.4% |
| Interquartile 75% (IQ3) | 7.3% | 8.3% |
| Interquartile Range (IQR) | 3.2% | 3.9% |
| Standard Deviation (Sample) | 19.4% | 3.6% |
| Standard Deviation (Population) | 19.3% | 3.6% |
Similar Demographics by Male Unemployment
Demographics Similar to English by Male Unemployment
In terms of male unemployment, the demographic groups most similar to English are European (4.8%, a difference of 0.030%), Pennsylvania German (4.8%, a difference of 0.080%), Immigrants from Taiwan (4.8%, a difference of 0.24%), Carpatho Rusyn (4.8%, a difference of 0.26%), and Filipino (4.7%, a difference of 0.30%).
| Demographics | Rating | Rank | Male Unemployment |
| Swedes | 100.0 /100 | #11 | Exceptional 4.6% |
| Immigrants | Bolivia | 100.0 /100 | #12 | Exceptional 4.7% |
| Bolivians | 100.0 /100 | #13 | Exceptional 4.7% |
| Germans | 100.0 /100 | #14 | Exceptional 4.7% |
| Scandinavians | 100.0 /100 | #15 | Exceptional 4.7% |
| Swiss | 99.9 /100 | #16 | Exceptional 4.7% |
| Filipinos | 99.9 /100 | #17 | Exceptional 4.7% |
| English | 99.9 /100 | #18 | Exceptional 4.8% |
| Europeans | 99.9 /100 | #19 | Exceptional 4.8% |
| Pennsylvania Germans | 99.9 /100 | #20 | Exceptional 4.8% |
| Immigrants | Taiwan | 99.9 /100 | #21 | Exceptional 4.8% |
| Carpatho Rusyns | 99.9 /100 | #22 | Exceptional 4.8% |
| Tongans | 99.9 /100 | #23 | Exceptional 4.8% |
| Immigrants | South Central Asia | 99.9 /100 | #24 | Exceptional 4.8% |
| Zimbabweans | 99.9 /100 | #25 | Exceptional 4.8% |
Demographics Similar to Immigrants from Panama by Male Unemployment
In terms of male unemployment, the demographic groups most similar to Immigrants from Panama are Immigrants from Cambodia (5.6%, a difference of 0.0%), Seminole (5.6%, a difference of 0.020%), Central American (5.6%, a difference of 0.020%), Immigrants from Africa (5.6%, a difference of 0.060%), and Panamanian (5.6%, a difference of 0.090%).
| Demographics | Rating | Rank | Male Unemployment |
| Portuguese | 3.5 /100 | #220 | Tragic 5.6% |
| Soviet Union | 3.2 /100 | #221 | Tragic 5.6% |
| Immigrants | Micronesia | 2.9 /100 | #222 | Tragic 5.6% |
| Creek | 2.6 /100 | #223 | Tragic 5.6% |
| Cherokee | 2.4 /100 | #224 | Tragic 5.6% |
| Panamanians | 1.9 /100 | #225 | Tragic 5.6% |
| Immigrants | Cambodia | 1.8 /100 | #226 | Tragic 5.6% |
| Immigrants | Panama | 1.8 /100 | #227 | Tragic 5.6% |
| Seminole | 1.8 /100 | #228 | Tragic 5.6% |
| Central Americans | 1.8 /100 | #229 | Tragic 5.6% |
| Immigrants | Africa | 1.7 /100 | #230 | Tragic 5.6% |
| Choctaw | 1.6 /100 | #231 | Tragic 5.6% |
| Moroccans | 1.6 /100 | #232 | Tragic 5.6% |
| Somalis | 1.5 /100 | #233 | Tragic 5.6% |
| Immigrants | Somalia | 1.5 /100 | #234 | Tragic 5.6% |