English vs Immigrants from North America Associate's Degree
COMPARE
English
Immigrants from North America
Associate's Degree
Associate's Degree Comparison
English
Immigrants from North America
46.4%
ASSOCIATE'S DEGREE
50.0/ 100
METRIC RATING
174th/ 347
METRIC RANK
50.1%
ASSOCIATE'S DEGREE
98.7/ 100
METRIC RATING
92nd/ 347
METRIC RANK
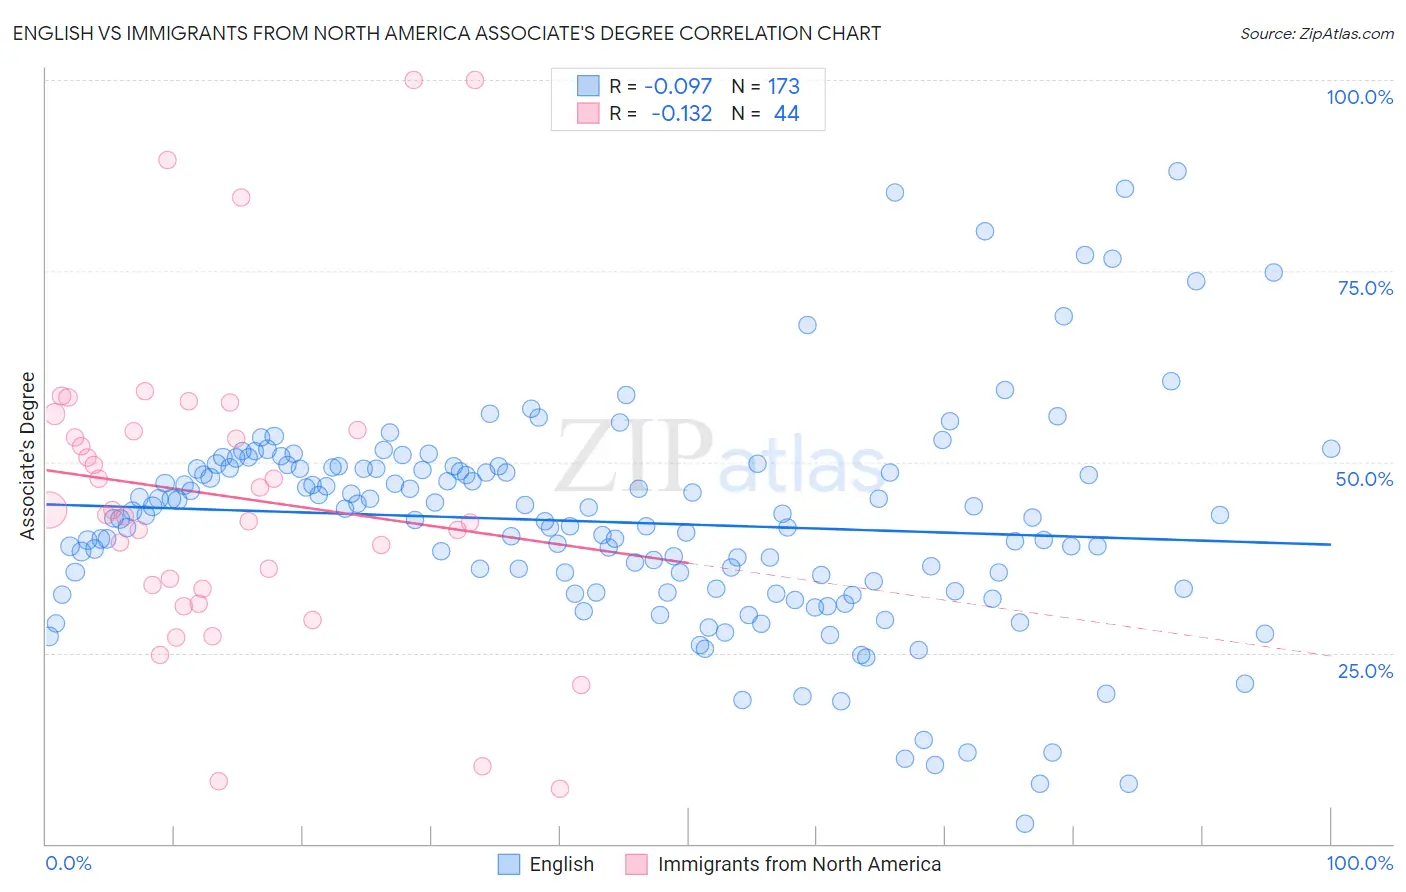
English vs Immigrants from North America Associate's Degree Correlation Chart
The statistical analysis conducted on geographies consisting of 579,836,667 people shows a slight negative correlation between the proportion of English and percentage of population with at least associate's degree education in the United States with a correlation coefficient (R) of -0.097 and weighted average of 46.4%. Similarly, the statistical analysis conducted on geographies consisting of 462,434,172 people shows a poor negative correlation between the proportion of Immigrants from North America and percentage of population with at least associate's degree education in the United States with a correlation coefficient (R) of -0.132 and weighted average of 50.1%, a difference of 8.0%.
Associate's Degree Correlation Summary
| Measurement | English | Immigrants from North America |
| Minimum | 2.6% | 7.1% |
| Maximum | 88.0% | 100.0% |
| Range | 85.4% | 92.9% |
| Mean | 42.1% | 45.6% |
| Median | 43.1% | 43.4% |
| Interquartile 25% (IQ1) | 33.3% | 33.6% |
| Interquartile 75% (IQ3) | 49.2% | 54.1% |
| Interquartile Range (IQR) | 15.8% | 20.5% |
| Standard Deviation (Sample) | 14.2% | 20.4% |
| Standard Deviation (Population) | 14.2% | 20.1% |
Similar Demographics by Associate's Degree
Demographics Similar to English by Associate's Degree
In terms of associate's degree, the demographic groups most similar to English are Immigrants from Iraq (46.4%, a difference of 0.020%), Peruvian (46.4%, a difference of 0.040%), Belgian (46.3%, a difference of 0.090%), Finnish (46.3%, a difference of 0.11%), and Slovak (46.3%, a difference of 0.12%).
| Demographics | Rating | Rank | Associate's Degree |
| Immigrants | Sierra Leone | 59.2 /100 | #167 | Average 46.7% |
| Immigrants | Somalia | 55.5 /100 | #168 | Average 46.5% |
| Uruguayans | 55.4 /100 | #169 | Average 46.5% |
| Irish | 53.6 /100 | #170 | Average 46.5% |
| Basques | 52.8 /100 | #171 | Average 46.5% |
| Peruvians | 50.5 /100 | #172 | Average 46.4% |
| Immigrants | Iraq | 50.3 /100 | #173 | Average 46.4% |
| English | 50.0 /100 | #174 | Average 46.4% |
| Belgians | 48.9 /100 | #175 | Average 46.3% |
| Finns | 48.5 /100 | #176 | Average 46.3% |
| Slovaks | 48.4 /100 | #177 | Average 46.3% |
| Immigrants | Bosnia and Herzegovina | 48.3 /100 | #178 | Average 46.3% |
| Sri Lankans | 47.6 /100 | #179 | Average 46.3% |
| Bermudans | 46.4 /100 | #180 | Average 46.2% |
| Immigrants | Colombia | 41.3 /100 | #181 | Average 46.0% |
Demographics Similar to Immigrants from North America by Associate's Degree
In terms of associate's degree, the demographic groups most similar to Immigrants from North America are Immigrants from Western Asia (50.1%, a difference of 0.020%), Immigrants from Ethiopia (50.1%, a difference of 0.10%), Immigrants from Canada (50.1%, a difference of 0.11%), Immigrants from Western Europe (50.1%, a difference of 0.11%), and Immigrants from Brazil (50.0%, a difference of 0.15%).
| Demographics | Rating | Rank | Associate's Degree |
| Immigrants | Egypt | 98.9 /100 | #85 | Exceptional 50.2% |
| Immigrants | Croatia | 98.9 /100 | #86 | Exceptional 50.2% |
| Immigrants | Moldova | 98.8 /100 | #87 | Exceptional 50.2% |
| Immigrants | Canada | 98.7 /100 | #88 | Exceptional 50.1% |
| Immigrants | Western Europe | 98.7 /100 | #89 | Exceptional 50.1% |
| Immigrants | Ethiopia | 98.7 /100 | #90 | Exceptional 50.1% |
| Immigrants | Western Asia | 98.7 /100 | #91 | Exceptional 50.1% |
| Immigrants | North America | 98.7 /100 | #92 | Exceptional 50.1% |
| Immigrants | Brazil | 98.5 /100 | #93 | Exceptional 50.0% |
| Laotians | 98.4 /100 | #94 | Exceptional 49.9% |
| Immigrants | England | 98.0 /100 | #95 | Exceptional 49.7% |
| Romanians | 98.0 /100 | #96 | Exceptional 49.7% |
| Immigrants | Ukraine | 98.0 /100 | #97 | Exceptional 49.7% |
| Immigrants | Northern Africa | 97.9 /100 | #98 | Exceptional 49.7% |
| Macedonians | 97.8 /100 | #99 | Exceptional 49.6% |