Egyptian vs Immigrants from Uganda Female Unemployment
COMPARE
Egyptian
Immigrants from Uganda
Female Unemployment
Female Unemployment Comparison
Egyptians
Immigrants from Uganda
5.2%
FEMALE UNEMPLOYMENT
78.3/ 100
METRIC RATING
150th/ 347
METRIC RANK
5.3%
FEMALE UNEMPLOYMENT
50.7/ 100
METRIC RATING
172nd/ 347
METRIC RANK
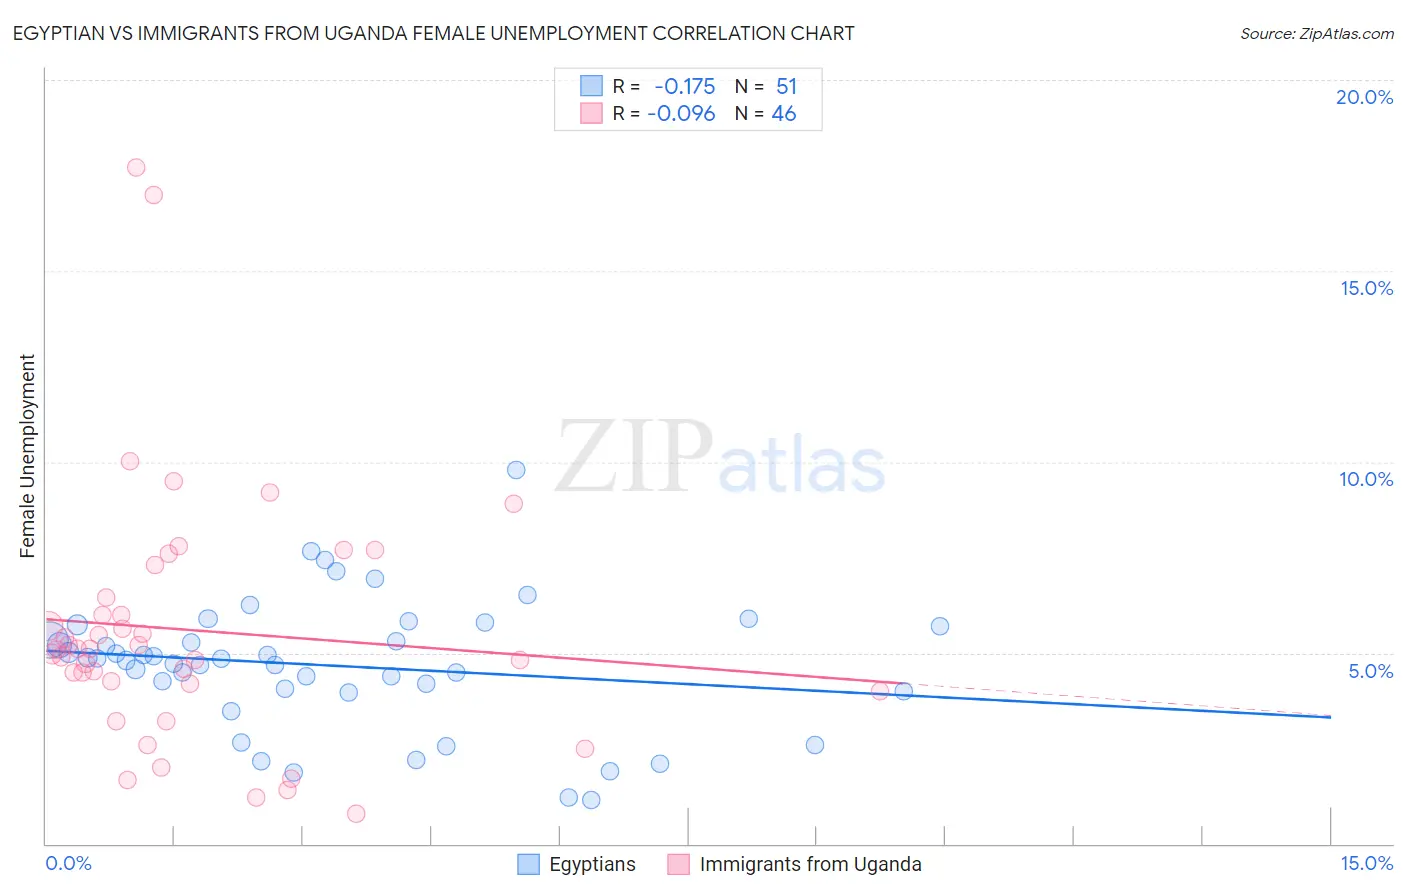
Egyptian vs Immigrants from Uganda Female Unemployment Correlation Chart
The statistical analysis conducted on geographies consisting of 276,383,478 people shows a poor negative correlation between the proportion of Egyptians and unemploymnet rate among females in the United States with a correlation coefficient (R) of -0.175 and weighted average of 5.2%. Similarly, the statistical analysis conducted on geographies consisting of 125,901,956 people shows a slight negative correlation between the proportion of Immigrants from Uganda and unemploymnet rate among females in the United States with a correlation coefficient (R) of -0.096 and weighted average of 5.3%, a difference of 1.9%.
Female Unemployment Correlation Summary
| Measurement | Egyptian | Immigrants from Uganda |
| Minimum | 1.2% | 0.80% |
| Maximum | 9.8% | 17.7% |
| Range | 8.6% | 16.9% |
| Mean | 4.7% | 5.6% |
| Median | 4.9% | 5.1% |
| Interquartile 25% (IQ1) | 4.0% | 4.2% |
| Interquartile 75% (IQ3) | 5.7% | 6.5% |
| Interquartile Range (IQR) | 1.7% | 2.3% |
| Standard Deviation (Sample) | 1.7% | 3.4% |
| Standard Deviation (Population) | 1.7% | 3.3% |
Similar Demographics by Female Unemployment
Demographics Similar to Egyptians by Female Unemployment
In terms of female unemployment, the demographic groups most similar to Egyptians are Asian (5.2%, a difference of 0.010%), Immigrants from Argentina (5.2%, a difference of 0.040%), Argentinean (5.2%, a difference of 0.080%), Immigrants from Norway (5.2%, a difference of 0.10%), and Immigrants from Oceania (5.2%, a difference of 0.11%).
| Demographics | Rating | Rank | Female Unemployment |
| Immigrants | Kazakhstan | 80.7 /100 | #143 | Excellent 5.1% |
| Immigrants | Jordan | 80.4 /100 | #144 | Excellent 5.1% |
| Immigrants | Oceania | 79.5 /100 | #145 | Good 5.2% |
| Immigrants | Norway | 79.4 /100 | #146 | Good 5.2% |
| Argentineans | 79.2 /100 | #147 | Good 5.2% |
| Immigrants | Argentina | 78.7 /100 | #148 | Good 5.2% |
| Asians | 78.3 /100 | #149 | Good 5.2% |
| Egyptians | 78.3 /100 | #150 | Good 5.2% |
| Immigrants | China | 75.9 /100 | #151 | Good 5.2% |
| Immigrants | Italy | 75.0 /100 | #152 | Good 5.2% |
| Immigrants | Greece | 74.9 /100 | #153 | Good 5.2% |
| South Africans | 70.8 /100 | #154 | Good 5.2% |
| Immigrants | Egypt | 70.0 /100 | #155 | Good 5.2% |
| Immigrants | Northern Africa | 69.6 /100 | #156 | Good 5.2% |
| Immigrants | Russia | 69.3 /100 | #157 | Good 5.2% |
Demographics Similar to Immigrants from Uganda by Female Unemployment
In terms of female unemployment, the demographic groups most similar to Immigrants from Uganda are Iranian (5.3%, a difference of 0.020%), Immigrants from Poland (5.3%, a difference of 0.040%), Immigrants from Laos (5.3%, a difference of 0.19%), Immigrants from Vietnam (5.3%, a difference of 0.19%), and Immigrants from Morocco (5.3%, a difference of 0.20%).
| Demographics | Rating | Rank | Female Unemployment |
| Syrians | 62.8 /100 | #165 | Good 5.2% |
| Native Hawaiians | 62.7 /100 | #166 | Good 5.2% |
| Immigrants | Thailand | 62.1 /100 | #167 | Good 5.2% |
| Sri Lankans | 59.4 /100 | #168 | Average 5.2% |
| Immigrants | Chile | 59.0 /100 | #169 | Average 5.2% |
| Spanish | 55.9 /100 | #170 | Average 5.2% |
| Immigrants | Denmark | 55.0 /100 | #171 | Average 5.2% |
| Immigrants | Uganda | 50.7 /100 | #172 | Average 5.3% |
| Iranians | 50.4 /100 | #173 | Average 5.3% |
| Immigrants | Poland | 50.0 /100 | #174 | Average 5.3% |
| Immigrants | Laos | 47.5 /100 | #175 | Average 5.3% |
| Immigrants | Vietnam | 47.5 /100 | #176 | Average 5.3% |
| Immigrants | Morocco | 47.4 /100 | #177 | Average 5.3% |
| Immigrants | Southern Europe | 46.2 /100 | #178 | Average 5.3% |
| Laotians | 45.1 /100 | #179 | Average 5.3% |