Egyptian vs Hawaiian Female Unemployment
COMPARE
Egyptian
Hawaiian
Female Unemployment
Female Unemployment Comparison
Egyptians
Hawaiians
5.2%
FEMALE UNEMPLOYMENT
78.3/ 100
METRIC RATING
150th/ 347
METRIC RANK
5.4%
FEMALE UNEMPLOYMENT
22.2/ 100
METRIC RATING
199th/ 347
METRIC RANK
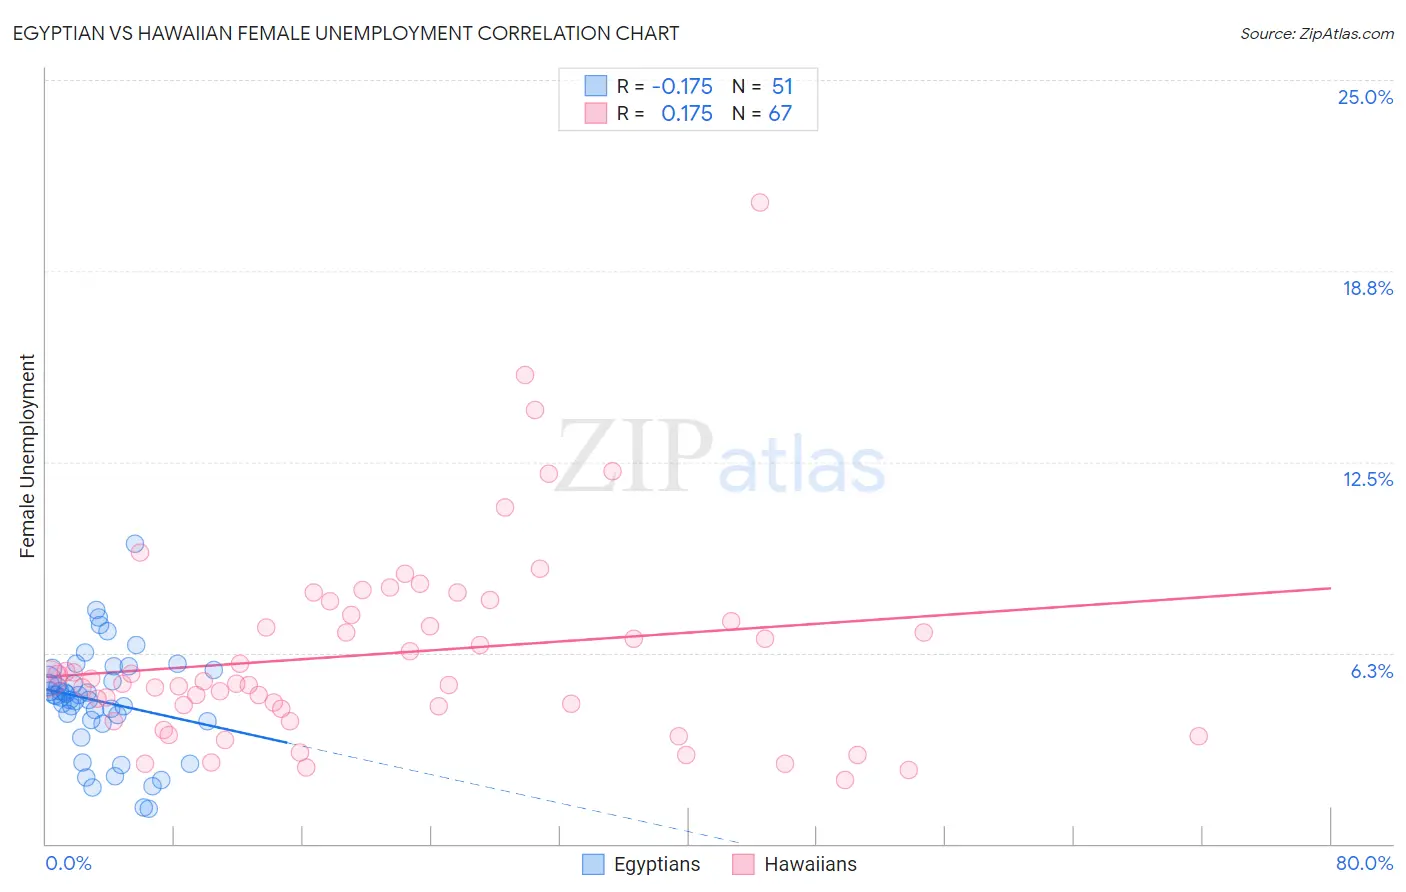
Egyptian vs Hawaiian Female Unemployment Correlation Chart
The statistical analysis conducted on geographies consisting of 276,383,478 people shows a poor negative correlation between the proportion of Egyptians and unemploymnet rate among females in the United States with a correlation coefficient (R) of -0.175 and weighted average of 5.2%. Similarly, the statistical analysis conducted on geographies consisting of 326,158,717 people shows a poor positive correlation between the proportion of Hawaiians and unemploymnet rate among females in the United States with a correlation coefficient (R) of 0.175 and weighted average of 5.4%, a difference of 3.9%.
Female Unemployment Correlation Summary
| Measurement | Egyptian | Hawaiian |
| Minimum | 1.2% | 2.1% |
| Maximum | 9.8% | 21.0% |
| Range | 8.6% | 18.9% |
| Mean | 4.7% | 6.2% |
| Median | 4.9% | 5.3% |
| Interquartile 25% (IQ1) | 4.0% | 4.4% |
| Interquartile 75% (IQ3) | 5.7% | 7.5% |
| Interquartile Range (IQR) | 1.7% | 3.1% |
| Standard Deviation (Sample) | 1.7% | 3.3% |
| Standard Deviation (Population) | 1.7% | 3.3% |
Similar Demographics by Female Unemployment
Demographics Similar to Egyptians by Female Unemployment
In terms of female unemployment, the demographic groups most similar to Egyptians are Asian (5.2%, a difference of 0.010%), Immigrants from Argentina (5.2%, a difference of 0.040%), Argentinean (5.2%, a difference of 0.080%), Immigrants from Norway (5.2%, a difference of 0.10%), and Immigrants from Oceania (5.2%, a difference of 0.11%).
| Demographics | Rating | Rank | Female Unemployment |
| Immigrants | Kazakhstan | 80.7 /100 | #143 | Excellent 5.1% |
| Immigrants | Jordan | 80.4 /100 | #144 | Excellent 5.1% |
| Immigrants | Oceania | 79.5 /100 | #145 | Good 5.2% |
| Immigrants | Norway | 79.4 /100 | #146 | Good 5.2% |
| Argentineans | 79.2 /100 | #147 | Good 5.2% |
| Immigrants | Argentina | 78.7 /100 | #148 | Good 5.2% |
| Asians | 78.3 /100 | #149 | Good 5.2% |
| Egyptians | 78.3 /100 | #150 | Good 5.2% |
| Immigrants | China | 75.9 /100 | #151 | Good 5.2% |
| Immigrants | Italy | 75.0 /100 | #152 | Good 5.2% |
| Immigrants | Greece | 74.9 /100 | #153 | Good 5.2% |
| South Africans | 70.8 /100 | #154 | Good 5.2% |
| Immigrants | Egypt | 70.0 /100 | #155 | Good 5.2% |
| Immigrants | Northern Africa | 69.6 /100 | #156 | Good 5.2% |
| Immigrants | Russia | 69.3 /100 | #157 | Good 5.2% |
Demographics Similar to Hawaiians by Female Unemployment
In terms of female unemployment, the demographic groups most similar to Hawaiians are Soviet Union (5.4%, a difference of 0.040%), Tsimshian (5.4%, a difference of 0.080%), Immigrants from Middle Africa (5.4%, a difference of 0.12%), Iroquois (5.4%, a difference of 0.12%), and Alsatian (5.3%, a difference of 0.14%).
| Demographics | Rating | Rank | Female Unemployment |
| Portuguese | 28.6 /100 | #192 | Fair 5.3% |
| Arabs | 27.7 /100 | #193 | Fair 5.3% |
| Colombians | 27.0 /100 | #194 | Fair 5.3% |
| Immigrants | Colombia | 26.2 /100 | #195 | Fair 5.3% |
| Spaniards | 25.2 /100 | #196 | Fair 5.3% |
| Alsatians | 23.9 /100 | #197 | Fair 5.3% |
| Tsimshian | 23.1 /100 | #198 | Fair 5.4% |
| Hawaiians | 22.2 /100 | #199 | Fair 5.4% |
| Soviet Union | 21.7 /100 | #200 | Fair 5.4% |
| Immigrants | Middle Africa | 20.8 /100 | #201 | Fair 5.4% |
| Iroquois | 20.8 /100 | #202 | Fair 5.4% |
| Immigrants | South Eastern Asia | 20.3 /100 | #203 | Fair 5.4% |
| Immigrants | Israel | 19.7 /100 | #204 | Poor 5.4% |
| Immigrants | Afghanistan | 18.9 /100 | #205 | Poor 5.4% |
| Immigrants | Brazil | 18.8 /100 | #206 | Poor 5.4% |