Spaniard vs Immigrants from Uganda Female Unemployment
COMPARE
Spaniard
Immigrants from Uganda
Female Unemployment
Female Unemployment Comparison
Spaniards
Immigrants from Uganda
5.3%
FEMALE UNEMPLOYMENT
25.2/ 100
METRIC RATING
196th/ 347
METRIC RANK
5.3%
FEMALE UNEMPLOYMENT
50.7/ 100
METRIC RATING
172nd/ 347
METRIC RANK
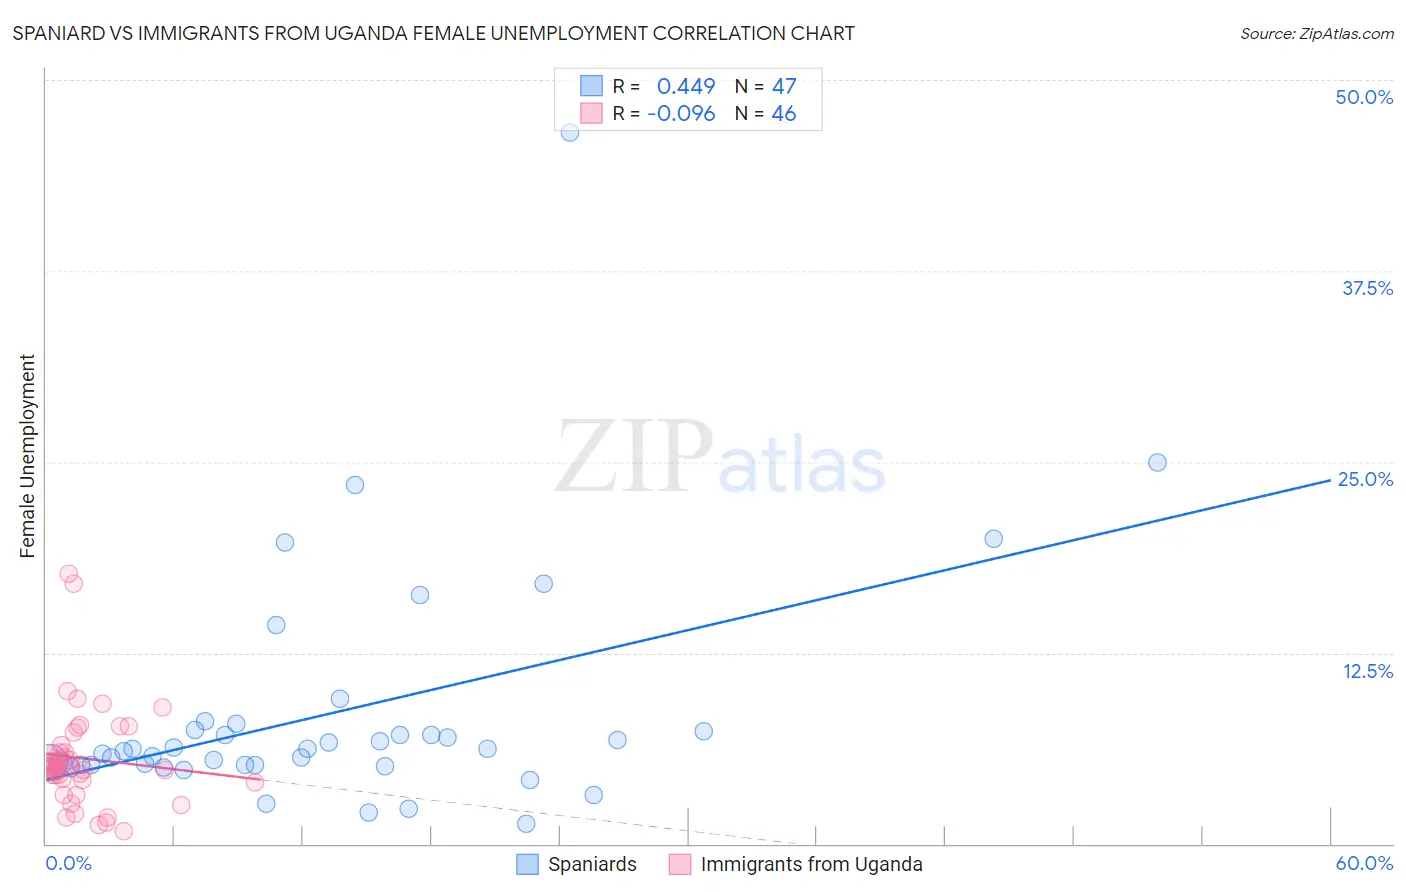
Spaniard vs Immigrants from Uganda Female Unemployment Correlation Chart
The statistical analysis conducted on geographies consisting of 440,755,407 people shows a moderate positive correlation between the proportion of Spaniards and unemploymnet rate among females in the United States with a correlation coefficient (R) of 0.449 and weighted average of 5.3%. Similarly, the statistical analysis conducted on geographies consisting of 125,901,956 people shows a slight negative correlation between the proportion of Immigrants from Uganda and unemploymnet rate among females in the United States with a correlation coefficient (R) of -0.096 and weighted average of 5.3%, a difference of 1.7%.
Female Unemployment Correlation Summary
| Measurement | Spaniard | Immigrants from Uganda |
| Minimum | 1.3% | 0.80% |
| Maximum | 46.6% | 17.7% |
| Range | 45.3% | 16.9% |
| Mean | 8.6% | 5.6% |
| Median | 6.2% | 5.1% |
| Interquartile 25% (IQ1) | 5.2% | 4.2% |
| Interquartile 75% (IQ3) | 7.4% | 6.5% |
| Interquartile Range (IQR) | 2.2% | 2.3% |
| Standard Deviation (Sample) | 7.8% | 3.4% |
| Standard Deviation (Population) | 7.7% | 3.3% |
Similar Demographics by Female Unemployment
Demographics Similar to Spaniards by Female Unemployment
In terms of female unemployment, the demographic groups most similar to Spaniards are Immigrants from Colombia (5.3%, a difference of 0.080%), Alsatian (5.3%, a difference of 0.10%), Colombian (5.3%, a difference of 0.14%), Tsimshian (5.4%, a difference of 0.17%), and Arab (5.3%, a difference of 0.19%).
| Demographics | Rating | Rank | Female Unemployment |
| Costa Ricans | 33.8 /100 | #189 | Fair 5.3% |
| Ugandans | 31.2 /100 | #190 | Fair 5.3% |
| Cherokee | 30.8 /100 | #191 | Fair 5.3% |
| Portuguese | 28.6 /100 | #192 | Fair 5.3% |
| Arabs | 27.7 /100 | #193 | Fair 5.3% |
| Colombians | 27.0 /100 | #194 | Fair 5.3% |
| Immigrants | Colombia | 26.2 /100 | #195 | Fair 5.3% |
| Spaniards | 25.2 /100 | #196 | Fair 5.3% |
| Alsatians | 23.9 /100 | #197 | Fair 5.3% |
| Tsimshian | 23.1 /100 | #198 | Fair 5.4% |
| Hawaiians | 22.2 /100 | #199 | Fair 5.4% |
| Soviet Union | 21.7 /100 | #200 | Fair 5.4% |
| Immigrants | Middle Africa | 20.8 /100 | #201 | Fair 5.4% |
| Iroquois | 20.8 /100 | #202 | Fair 5.4% |
| Immigrants | South Eastern Asia | 20.3 /100 | #203 | Fair 5.4% |
Demographics Similar to Immigrants from Uganda by Female Unemployment
In terms of female unemployment, the demographic groups most similar to Immigrants from Uganda are Iranian (5.3%, a difference of 0.020%), Immigrants from Poland (5.3%, a difference of 0.040%), Immigrants from Laos (5.3%, a difference of 0.19%), Immigrants from Vietnam (5.3%, a difference of 0.19%), and Immigrants from Morocco (5.3%, a difference of 0.20%).
| Demographics | Rating | Rank | Female Unemployment |
| Syrians | 62.8 /100 | #165 | Good 5.2% |
| Native Hawaiians | 62.7 /100 | #166 | Good 5.2% |
| Immigrants | Thailand | 62.1 /100 | #167 | Good 5.2% |
| Sri Lankans | 59.4 /100 | #168 | Average 5.2% |
| Immigrants | Chile | 59.0 /100 | #169 | Average 5.2% |
| Spanish | 55.9 /100 | #170 | Average 5.2% |
| Immigrants | Denmark | 55.0 /100 | #171 | Average 5.2% |
| Immigrants | Uganda | 50.7 /100 | #172 | Average 5.3% |
| Iranians | 50.4 /100 | #173 | Average 5.3% |
| Immigrants | Poland | 50.0 /100 | #174 | Average 5.3% |
| Immigrants | Laos | 47.5 /100 | #175 | Average 5.3% |
| Immigrants | Vietnam | 47.5 /100 | #176 | Average 5.3% |
| Immigrants | Morocco | 47.4 /100 | #177 | Average 5.3% |
| Immigrants | Southern Europe | 46.2 /100 | #178 | Average 5.3% |
| Laotians | 45.1 /100 | #179 | Average 5.3% |