Egyptian vs Immigrants from Barbados Female Unemployment
COMPARE
Egyptian
Immigrants from Barbados
Female Unemployment
Female Unemployment Comparison
Egyptians
Immigrants from Barbados
5.2%
FEMALE UNEMPLOYMENT
78.3/ 100
METRIC RATING
150th/ 347
METRIC RANK
6.2%
FEMALE UNEMPLOYMENT
0.0/ 100
METRIC RATING
301st/ 347
METRIC RANK
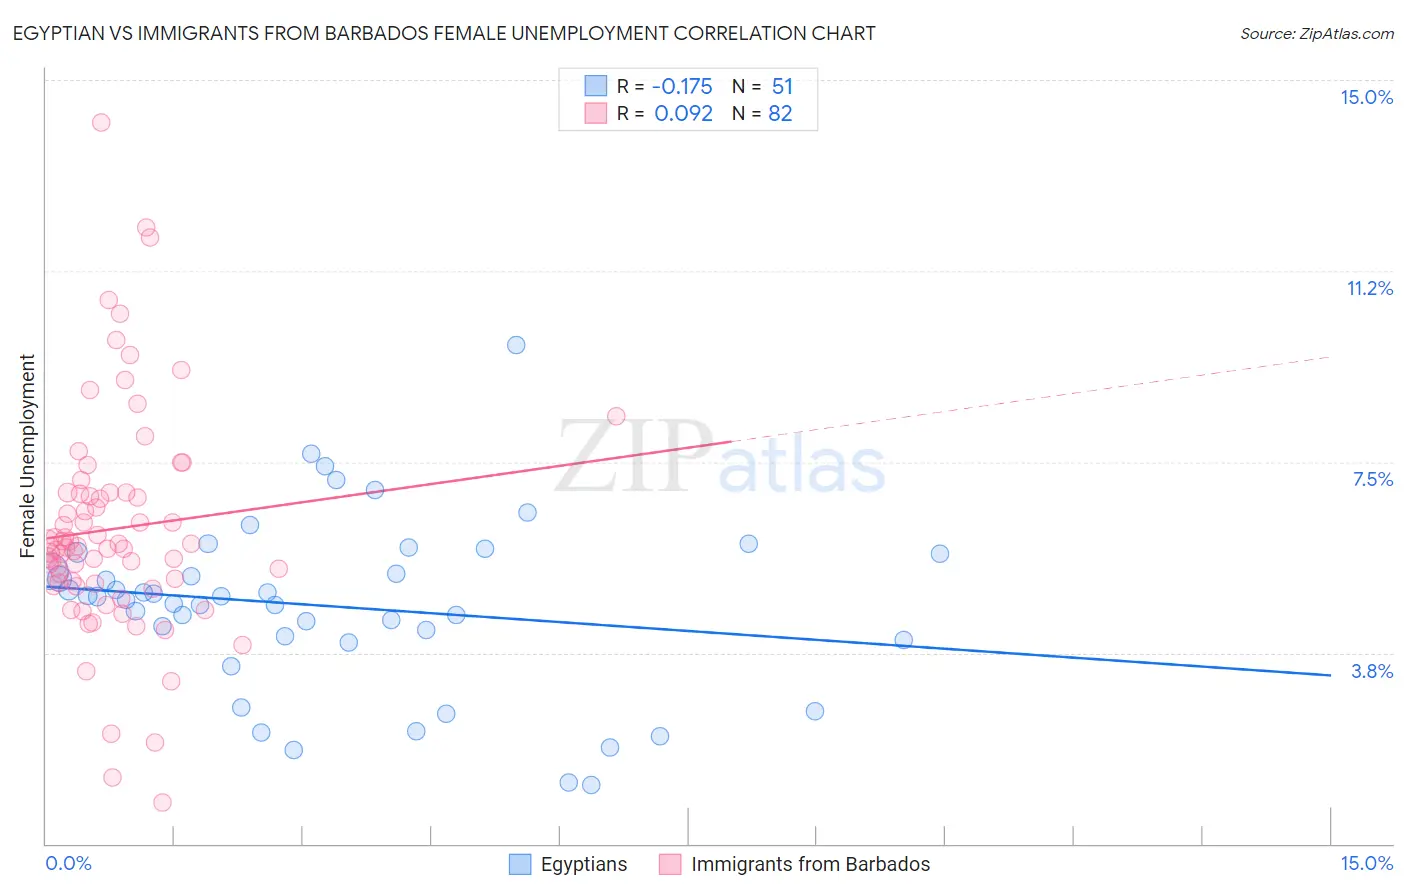
Egyptian vs Immigrants from Barbados Female Unemployment Correlation Chart
The statistical analysis conducted on geographies consisting of 276,383,478 people shows a poor negative correlation between the proportion of Egyptians and unemploymnet rate among females in the United States with a correlation coefficient (R) of -0.175 and weighted average of 5.2%. Similarly, the statistical analysis conducted on geographies consisting of 112,711,300 people shows a slight positive correlation between the proportion of Immigrants from Barbados and unemploymnet rate among females in the United States with a correlation coefficient (R) of 0.092 and weighted average of 6.2%, a difference of 19.5%.
Female Unemployment Correlation Summary
| Measurement | Egyptian | Immigrants from Barbados |
| Minimum | 1.2% | 0.80% |
| Maximum | 9.8% | 14.2% |
| Range | 8.6% | 13.4% |
| Mean | 4.7% | 6.2% |
| Median | 4.9% | 5.8% |
| Interquartile 25% (IQ1) | 4.0% | 5.1% |
| Interquartile 75% (IQ3) | 5.7% | 6.9% |
| Interquartile Range (IQR) | 1.7% | 1.8% |
| Standard Deviation (Sample) | 1.7% | 2.2% |
| Standard Deviation (Population) | 1.7% | 2.2% |
Similar Demographics by Female Unemployment
Demographics Similar to Egyptians by Female Unemployment
In terms of female unemployment, the demographic groups most similar to Egyptians are Asian (5.2%, a difference of 0.010%), Immigrants from Argentina (5.2%, a difference of 0.040%), Argentinean (5.2%, a difference of 0.080%), Immigrants from Norway (5.2%, a difference of 0.10%), and Immigrants from Oceania (5.2%, a difference of 0.11%).
| Demographics | Rating | Rank | Female Unemployment |
| Immigrants | Kazakhstan | 80.7 /100 | #143 | Excellent 5.1% |
| Immigrants | Jordan | 80.4 /100 | #144 | Excellent 5.1% |
| Immigrants | Oceania | 79.5 /100 | #145 | Good 5.2% |
| Immigrants | Norway | 79.4 /100 | #146 | Good 5.2% |
| Argentineans | 79.2 /100 | #147 | Good 5.2% |
| Immigrants | Argentina | 78.7 /100 | #148 | Good 5.2% |
| Asians | 78.3 /100 | #149 | Good 5.2% |
| Egyptians | 78.3 /100 | #150 | Good 5.2% |
| Immigrants | China | 75.9 /100 | #151 | Good 5.2% |
| Immigrants | Italy | 75.0 /100 | #152 | Good 5.2% |
| Immigrants | Greece | 74.9 /100 | #153 | Good 5.2% |
| South Africans | 70.8 /100 | #154 | Good 5.2% |
| Immigrants | Egypt | 70.0 /100 | #155 | Good 5.2% |
| Immigrants | Northern Africa | 69.6 /100 | #156 | Good 5.2% |
| Immigrants | Russia | 69.3 /100 | #157 | Good 5.2% |
Demographics Similar to Immigrants from Barbados by Female Unemployment
In terms of female unemployment, the demographic groups most similar to Immigrants from Barbados are U.S. Virgin Islander (6.2%, a difference of 0.15%), Immigrants from Haiti (6.1%, a difference of 0.45%), Ute (6.1%, a difference of 0.50%), Barbadian (6.2%, a difference of 0.50%), and Jamaican (6.1%, a difference of 0.60%).
| Demographics | Rating | Rank | Female Unemployment |
| Immigrants | El Salvador | 0.0 /100 | #294 | Tragic 6.1% |
| Immigrants | Latin America | 0.0 /100 | #295 | Tragic 6.1% |
| Alaskan Athabascans | 0.0 /100 | #296 | Tragic 6.1% |
| West Indians | 0.0 /100 | #297 | Tragic 6.1% |
| Jamaicans | 0.0 /100 | #298 | Tragic 6.1% |
| Ute | 0.0 /100 | #299 | Tragic 6.1% |
| Immigrants | Haiti | 0.0 /100 | #300 | Tragic 6.1% |
| Immigrants | Barbados | 0.0 /100 | #301 | Tragic 6.2% |
| U.S. Virgin Islanders | 0.0 /100 | #302 | Tragic 6.2% |
| Barbadians | 0.0 /100 | #303 | Tragic 6.2% |
| Immigrants | Jamaica | 0.0 /100 | #304 | Tragic 6.2% |
| Spanish American Indians | 0.0 /100 | #305 | Tragic 6.2% |
| Immigrants | Central America | 0.0 /100 | #306 | Tragic 6.2% |
| Shoshone | 0.0 /100 | #307 | Tragic 6.2% |
| Hispanics or Latinos | 0.0 /100 | #308 | Tragic 6.2% |