Immigrants from Caribbean vs Immigrants from Uganda Female Unemployment
COMPARE
Immigrants from Caribbean
Immigrants from Uganda
Female Unemployment
Female Unemployment Comparison
Immigrants from Caribbean
Immigrants from Uganda
6.1%
FEMALE UNEMPLOYMENT
0.0/ 100
METRIC RATING
290th/ 347
METRIC RANK
5.3%
FEMALE UNEMPLOYMENT
50.7/ 100
METRIC RATING
172nd/ 347
METRIC RANK
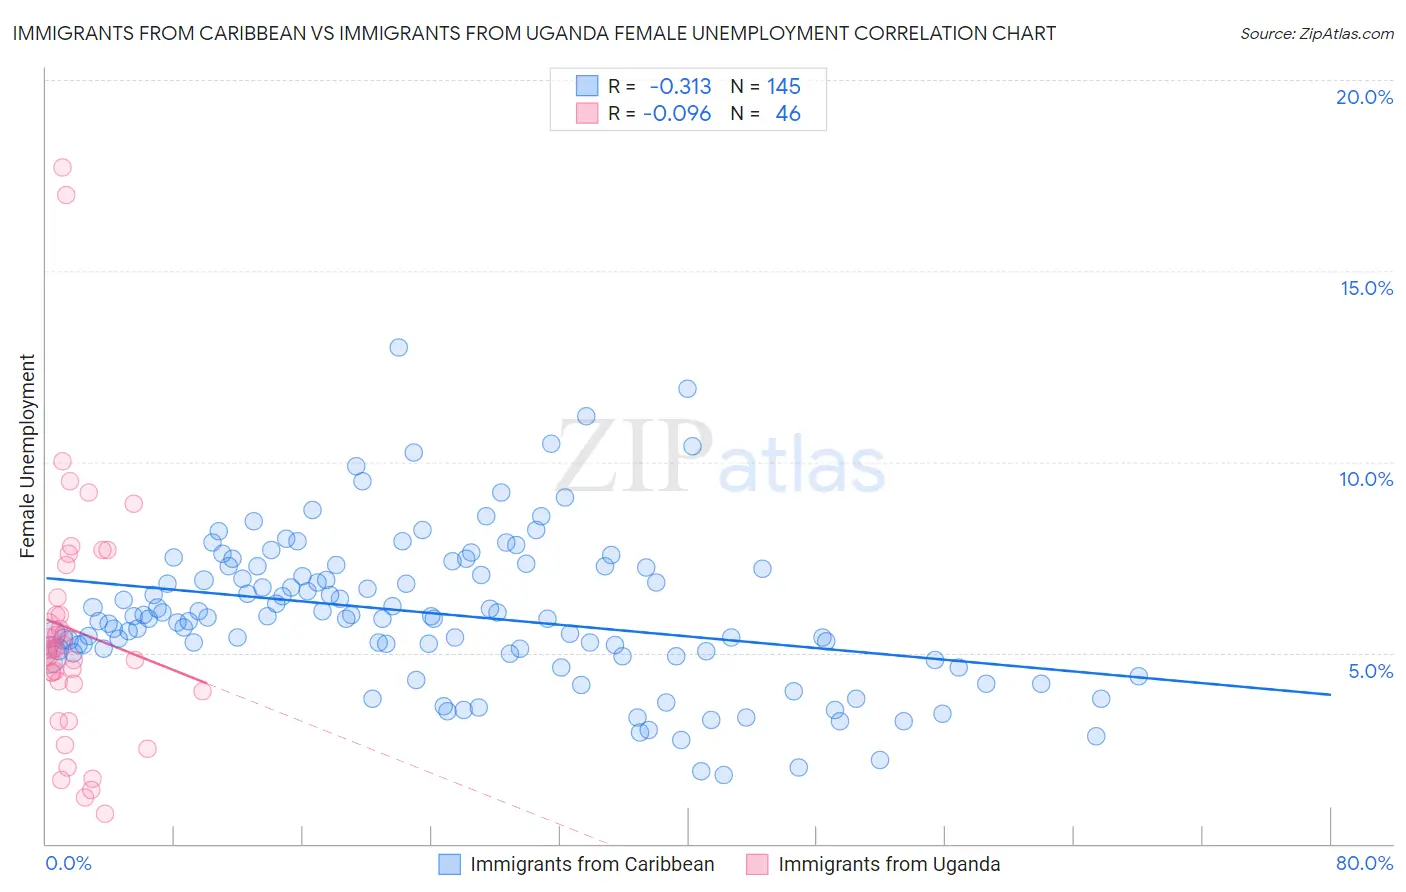
Immigrants from Caribbean vs Immigrants from Uganda Female Unemployment Correlation Chart
The statistical analysis conducted on geographies consisting of 447,357,611 people shows a mild negative correlation between the proportion of Immigrants from Caribbean and unemploymnet rate among females in the United States with a correlation coefficient (R) of -0.313 and weighted average of 6.1%. Similarly, the statistical analysis conducted on geographies consisting of 125,901,956 people shows a slight negative correlation between the proportion of Immigrants from Uganda and unemploymnet rate among females in the United States with a correlation coefficient (R) of -0.096 and weighted average of 5.3%, a difference of 15.9%.
Female Unemployment Correlation Summary
| Measurement | Immigrants from Caribbean | Immigrants from Uganda |
| Minimum | 1.8% | 0.80% |
| Maximum | 13.0% | 17.7% |
| Range | 11.2% | 16.9% |
| Mean | 6.0% | 5.6% |
| Median | 5.9% | 5.1% |
| Interquartile 25% (IQ1) | 5.0% | 4.2% |
| Interquartile 75% (IQ3) | 7.3% | 6.5% |
| Interquartile Range (IQR) | 2.3% | 2.3% |
| Standard Deviation (Sample) | 2.0% | 3.4% |
| Standard Deviation (Population) | 2.0% | 3.3% |
Similar Demographics by Female Unemployment
Demographics Similar to Immigrants from Caribbean by Female Unemployment
In terms of female unemployment, the demographic groups most similar to Immigrants from Caribbean are Trinidadian and Tobagonian (6.1%, a difference of 0.060%), Haitian (6.1%, a difference of 0.070%), Immigrants from Guatemala (6.1%, a difference of 0.11%), Immigrants from West Indies (6.1%, a difference of 0.11%), and Chippewa (6.1%, a difference of 0.14%).
| Demographics | Rating | Rank | Female Unemployment |
| Salvadorans | 0.0 /100 | #283 | Tragic 6.0% |
| Immigrants | Senegal | 0.0 /100 | #284 | Tragic 6.1% |
| Immigrants | Cabo Verde | 0.0 /100 | #285 | Tragic 6.1% |
| Chippewa | 0.0 /100 | #286 | Tragic 6.1% |
| Immigrants | Guatemala | 0.0 /100 | #287 | Tragic 6.1% |
| Haitians | 0.0 /100 | #288 | Tragic 6.1% |
| Trinidadians and Tobagonians | 0.0 /100 | #289 | Tragic 6.1% |
| Immigrants | Caribbean | 0.0 /100 | #290 | Tragic 6.1% |
| Immigrants | West Indies | 0.0 /100 | #291 | Tragic 6.1% |
| Immigrants | Trinidad and Tobago | 0.0 /100 | #292 | Tragic 6.1% |
| Mexicans | 0.0 /100 | #293 | Tragic 6.1% |
| Immigrants | El Salvador | 0.0 /100 | #294 | Tragic 6.1% |
| Immigrants | Latin America | 0.0 /100 | #295 | Tragic 6.1% |
| Alaskan Athabascans | 0.0 /100 | #296 | Tragic 6.1% |
| West Indians | 0.0 /100 | #297 | Tragic 6.1% |
Demographics Similar to Immigrants from Uganda by Female Unemployment
In terms of female unemployment, the demographic groups most similar to Immigrants from Uganda are Iranian (5.3%, a difference of 0.020%), Immigrants from Poland (5.3%, a difference of 0.040%), Immigrants from Laos (5.3%, a difference of 0.19%), Immigrants from Vietnam (5.3%, a difference of 0.19%), and Immigrants from Morocco (5.3%, a difference of 0.20%).
| Demographics | Rating | Rank | Female Unemployment |
| Syrians | 62.8 /100 | #165 | Good 5.2% |
| Native Hawaiians | 62.7 /100 | #166 | Good 5.2% |
| Immigrants | Thailand | 62.1 /100 | #167 | Good 5.2% |
| Sri Lankans | 59.4 /100 | #168 | Average 5.2% |
| Immigrants | Chile | 59.0 /100 | #169 | Average 5.2% |
| Spanish | 55.9 /100 | #170 | Average 5.2% |
| Immigrants | Denmark | 55.0 /100 | #171 | Average 5.2% |
| Immigrants | Uganda | 50.7 /100 | #172 | Average 5.3% |
| Iranians | 50.4 /100 | #173 | Average 5.3% |
| Immigrants | Poland | 50.0 /100 | #174 | Average 5.3% |
| Immigrants | Laos | 47.5 /100 | #175 | Average 5.3% |
| Immigrants | Vietnam | 47.5 /100 | #176 | Average 5.3% |
| Immigrants | Morocco | 47.4 /100 | #177 | Average 5.3% |
| Immigrants | Southern Europe | 46.2 /100 | #178 | Average 5.3% |
| Laotians | 45.1 /100 | #179 | Average 5.3% |