Ecuadorian vs Inupiat Unemployment Among Women with Children Ages 6 to 17 years
COMPARE
Ecuadorian
Inupiat
Unemployment Among Women with Children Ages 6 to 17 years
Unemployment Among Women with Children Ages 6 to 17 years Comparison
Ecuadorians
Inupiat
10.0%
UNEMPLOYMENT AMONG WOMEN WITH CHILDREN AGES 6 TO 17 YEARS
0.0/ 100
METRIC RATING
294th/ 347
METRIC RANK
14.9%
UNEMPLOYMENT AMONG WOMEN WITH CHILDREN AGES 6 TO 17 YEARS
0.0/ 100
METRIC RATING
343rd/ 347
METRIC RANK
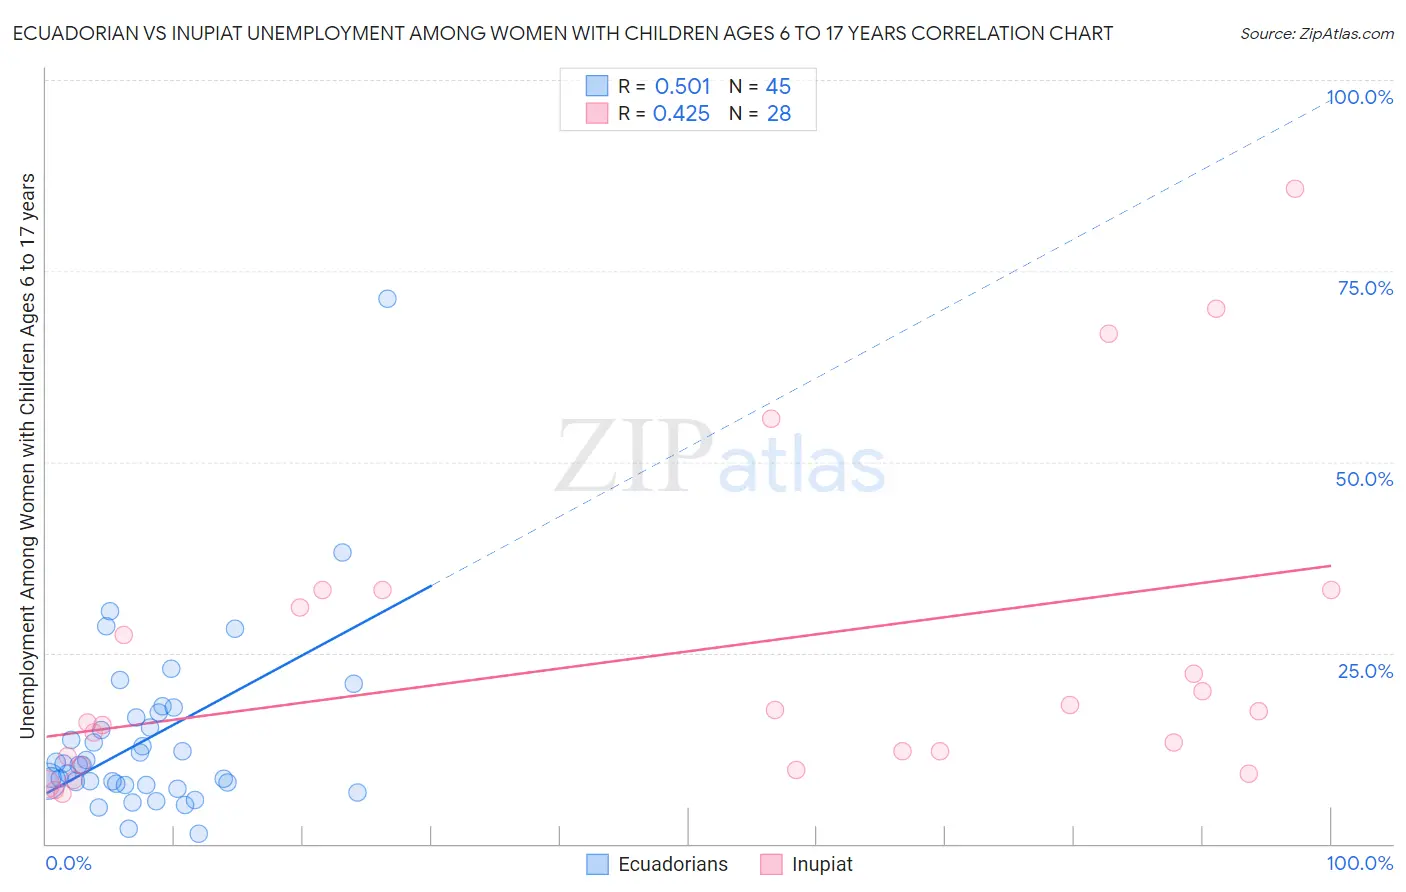
Ecuadorian vs Inupiat Unemployment Among Women with Children Ages 6 to 17 years Correlation Chart
The statistical analysis conducted on geographies consisting of 242,852,218 people shows a substantial positive correlation between the proportion of Ecuadorians and unemployment rate among women with children between the ages 6 and 17 in the United States with a correlation coefficient (R) of 0.501 and weighted average of 10.0%. Similarly, the statistical analysis conducted on geographies consisting of 85,509,455 people shows a moderate positive correlation between the proportion of Inupiat and unemployment rate among women with children between the ages 6 and 17 in the United States with a correlation coefficient (R) of 0.425 and weighted average of 14.9%, a difference of 48.1%.
Unemployment Among Women with Children Ages 6 to 17 years Correlation Summary
| Measurement | Ecuadorian | Inupiat |
| Minimum | 1.3% | 6.5% |
| Maximum | 71.4% | 85.7% |
| Range | 70.1% | 79.2% |
| Mean | 13.8% | 24.5% |
| Median | 10.3% | 16.6% |
| Interquartile 25% (IQ1) | 7.8% | 10.8% |
| Interquartile 75% (IQ3) | 16.8% | 32.2% |
| Interquartile Range (IQR) | 9.0% | 21.3% |
| Standard Deviation (Sample) | 11.7% | 20.8% |
| Standard Deviation (Population) | 11.6% | 20.4% |
Similar Demographics by Unemployment Among Women with Children Ages 6 to 17 years
Demographics Similar to Ecuadorians by Unemployment Among Women with Children Ages 6 to 17 years
In terms of unemployment among women with children ages 6 to 17 years, the demographic groups most similar to Ecuadorians are Cherokee (10.0%, a difference of 0.030%), Haitian (10.0%, a difference of 0.090%), Carpatho Rusyn (10.0%, a difference of 0.18%), Nonimmigrants (10.0%, a difference of 0.19%), and Subsaharan African (10.0%, a difference of 0.22%).
| Demographics | Rating | Rank | Unemployment Among Women with Children Ages 6 to 17 years |
| Sierra Leoneans | 0.0 /100 | #287 | Tragic 9.9% |
| Shoshone | 0.0 /100 | #288 | Tragic 10.0% |
| Hondurans | 0.0 /100 | #289 | Tragic 10.0% |
| Sub-Saharan Africans | 0.0 /100 | #290 | Tragic 10.0% |
| Immigrants | Nonimmigrants | 0.0 /100 | #291 | Tragic 10.0% |
| Carpatho Rusyns | 0.0 /100 | #292 | Tragic 10.0% |
| Haitians | 0.0 /100 | #293 | Tragic 10.0% |
| Ecuadorians | 0.0 /100 | #294 | Tragic 10.0% |
| Cherokee | 0.0 /100 | #295 | Tragic 10.0% |
| Immigrants | Western Africa | 0.0 /100 | #296 | Tragic 10.1% |
| Immigrants | Caribbean | 0.0 /100 | #297 | Tragic 10.1% |
| Immigrants | Haiti | 0.0 /100 | #298 | Tragic 10.1% |
| Immigrants | Honduras | 0.0 /100 | #299 | Tragic 10.1% |
| Nigerians | 0.0 /100 | #300 | Tragic 10.1% |
| Immigrants | Bahamas | 0.0 /100 | #301 | Tragic 10.1% |
Demographics Similar to Inupiat by Unemployment Among Women with Children Ages 6 to 17 years
In terms of unemployment among women with children ages 6 to 17 years, the demographic groups most similar to Inupiat are Yuman (14.8%, a difference of 0.29%), Navajo (14.2%, a difference of 4.9%), Puerto Rican (13.9%, a difference of 7.1%), Cheyenne (16.4%, a difference of 10.3%), and Sioux (13.2%, a difference of 12.2%).
| Demographics | Rating | Rank | Unemployment Among Women with Children Ages 6 to 17 years |
| Natives/Alaskans | 0.0 /100 | #333 | Tragic 11.5% |
| Ugandans | 0.0 /100 | #334 | Tragic 12.0% |
| Colville | 0.0 /100 | #335 | Tragic 12.3% |
| Houma | 0.0 /100 | #336 | Tragic 12.5% |
| Immigrants | Yemen | 0.0 /100 | #337 | Tragic 12.7% |
| Hopi | 0.0 /100 | #338 | Tragic 12.9% |
| Sioux | 0.0 /100 | #339 | Tragic 13.2% |
| Puerto Ricans | 0.0 /100 | #340 | Tragic 13.9% |
| Navajo | 0.0 /100 | #341 | Tragic 14.2% |
| Yuman | 0.0 /100 | #342 | Tragic 14.8% |
| Inupiat | 0.0 /100 | #343 | Tragic 14.9% |
| Cheyenne | 0.0 /100 | #344 | Tragic 16.4% |
| Arapaho | 0.0 /100 | #345 | Tragic 16.8% |
| Yup'ik | 0.0 /100 | #346 | Tragic 18.6% |
| Pima | 0.0 /100 | #347 | Tragic 18.9% |