Ecuadorian vs Scottish Nursery School
COMPARE
Ecuadorian
Scottish
Nursery School
Nursery School Comparison
Ecuadorians
Scottish
97.1%
NURSERY SCHOOL
0.0/ 100
METRIC RATING
304th/ 347
METRIC RANK
98.7%
NURSERY SCHOOL
100.0/ 100
METRIC RATING
16th/ 347
METRIC RANK
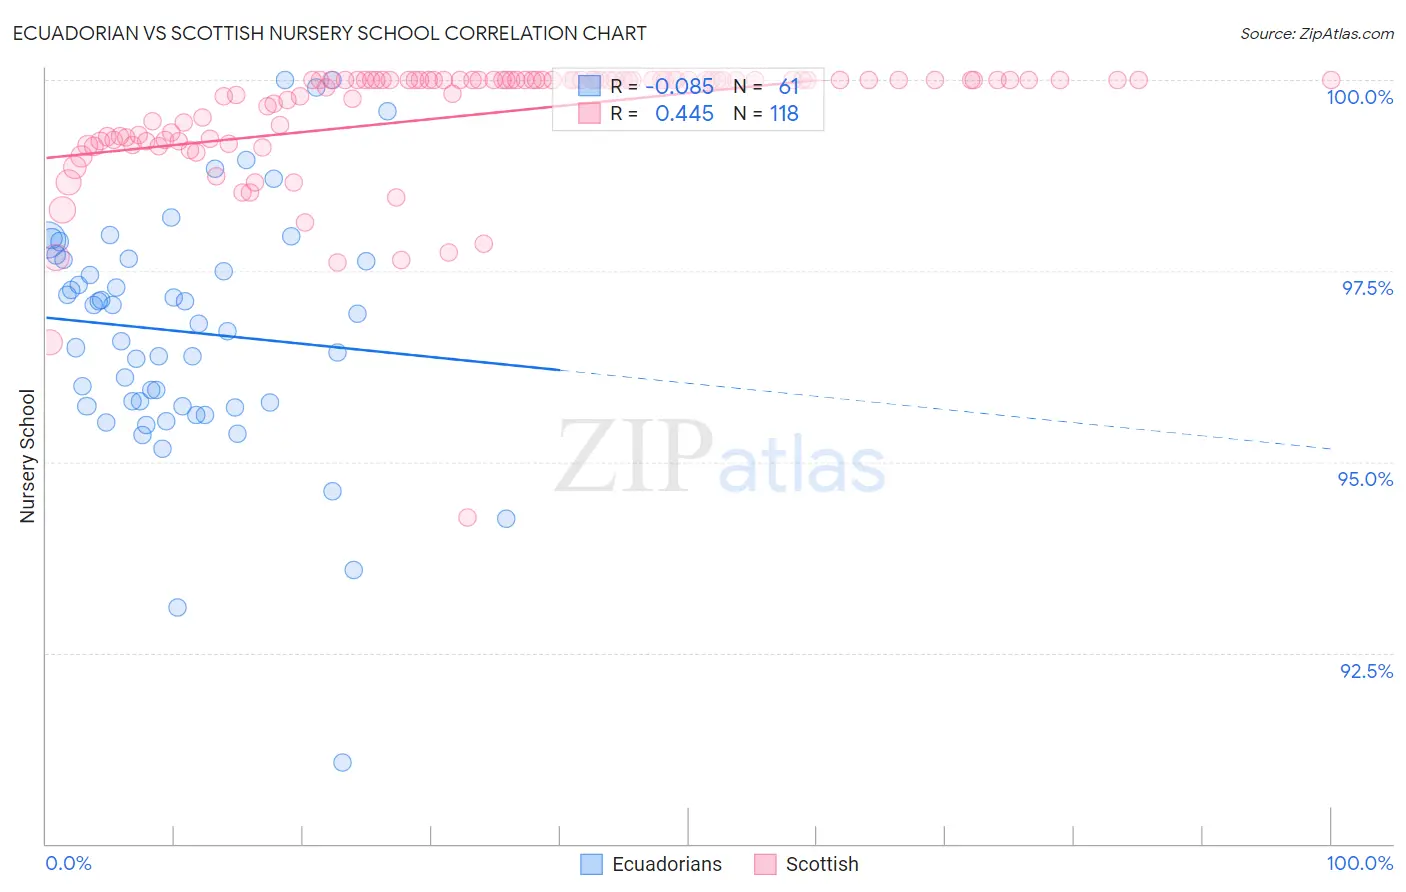
Ecuadorian vs Scottish Nursery School Correlation Chart
The statistical analysis conducted on geographies consisting of 317,865,723 people shows a slight negative correlation between the proportion of Ecuadorians and percentage of population with at least nursery school education in the United States with a correlation coefficient (R) of -0.085 and weighted average of 97.1%. Similarly, the statistical analysis conducted on geographies consisting of 567,141,733 people shows a moderate positive correlation between the proportion of Scottish and percentage of population with at least nursery school education in the United States with a correlation coefficient (R) of 0.445 and weighted average of 98.7%, a difference of 1.6%.
Nursery School Correlation Summary
| Measurement | Ecuadorian | Scottish |
| Minimum | 91.1% | 94.3% |
| Maximum | 100.0% | 100.0% |
| Range | 8.9% | 5.7% |
| Mean | 96.7% | 99.5% |
| Median | 96.8% | 100.0% |
| Interquartile 25% (IQ1) | 95.7% | 99.2% |
| Interquartile 75% (IQ3) | 97.7% | 100.0% |
| Interquartile Range (IQR) | 1.9% | 0.79% |
| Standard Deviation (Sample) | 1.6% | 0.83% |
| Standard Deviation (Population) | 1.6% | 0.83% |
Similar Demographics by Nursery School
Demographics Similar to Ecuadorians by Nursery School
In terms of nursery school, the demographic groups most similar to Ecuadorians are Somali (97.1%, a difference of 0.0%), Nicaraguan (97.1%, a difference of 0.010%), Immigrants from Caribbean (97.1%, a difference of 0.040%), Belizean (97.0%, a difference of 0.060%), and Immigrants from South Eastern Asia (97.1%, a difference of 0.070%).
| Demographics | Rating | Rank | Nursery School |
| Immigrants | Cuba | 0.0 /100 | #297 | Tragic 97.2% |
| Central American Indians | 0.0 /100 | #298 | Tragic 97.2% |
| Immigrants | Dominica | 0.0 /100 | #299 | Tragic 97.2% |
| Haitians | 0.0 /100 | #300 | Tragic 97.2% |
| Immigrants | South Eastern Asia | 0.0 /100 | #301 | Tragic 97.1% |
| Immigrants | Caribbean | 0.0 /100 | #302 | Tragic 97.1% |
| Nicaraguans | 0.0 /100 | #303 | Tragic 97.1% |
| Ecuadorians | 0.0 /100 | #304 | Tragic 97.1% |
| Somalis | 0.0 /100 | #305 | Tragic 97.1% |
| Belizeans | 0.0 /100 | #306 | Tragic 97.0% |
| Hispanics or Latinos | 0.0 /100 | #307 | Tragic 97.0% |
| Immigrants | Haiti | 0.0 /100 | #308 | Tragic 97.0% |
| Immigrants | Somalia | 0.0 /100 | #309 | Tragic 97.0% |
| Guyanese | 0.0 /100 | #310 | Tragic 97.0% |
| Immigrants | Azores | 0.0 /100 | #311 | Tragic 97.0% |
Demographics Similar to Scottish by Nursery School
In terms of nursery school, the demographic groups most similar to Scottish are Aleut (98.7%, a difference of 0.0%), Swedish (98.7%, a difference of 0.010%), Dutch (98.7%, a difference of 0.010%), English (98.7%, a difference of 0.030%), and Carpatho Rusyn (98.7%, a difference of 0.030%).
| Demographics | Rating | Rank | Nursery School |
| Slovaks | 100.0 /100 | #9 | Exceptional 98.7% |
| Germans | 100.0 /100 | #10 | Exceptional 98.7% |
| Tlingit-Haida | 100.0 /100 | #11 | Exceptional 98.7% |
| Slovenes | 100.0 /100 | #12 | Exceptional 98.7% |
| English | 100.0 /100 | #13 | Exceptional 98.7% |
| Carpatho Rusyns | 100.0 /100 | #14 | Exceptional 98.7% |
| Swedes | 100.0 /100 | #15 | Exceptional 98.7% |
| Scottish | 100.0 /100 | #16 | Exceptional 98.7% |
| Aleuts | 100.0 /100 | #17 | Exceptional 98.7% |
| Dutch | 100.0 /100 | #18 | Exceptional 98.7% |
| Irish | 100.0 /100 | #19 | Exceptional 98.6% |
| Pennsylvania Germans | 100.0 /100 | #20 | Exceptional 98.6% |
| Finns | 100.0 /100 | #21 | Exceptional 98.6% |
| Lithuanians | 100.0 /100 | #22 | Exceptional 98.6% |
| Poles | 100.0 /100 | #23 | Exceptional 98.6% |