Immigrants from Pakistan vs Inupiat Unemployment Among Women with Children Ages 6 to 17 years
COMPARE
Immigrants from Pakistan
Inupiat
Unemployment Among Women with Children Ages 6 to 17 years
Unemployment Among Women with Children Ages 6 to 17 years Comparison
Immigrants from Pakistan
Inupiat
8.6%
UNEMPLOYMENT AMONG WOMEN WITH CHILDREN AGES 6 TO 17 YEARS
98.4/ 100
METRIC RATING
101st/ 347
METRIC RANK
14.9%
UNEMPLOYMENT AMONG WOMEN WITH CHILDREN AGES 6 TO 17 YEARS
0.0/ 100
METRIC RATING
343rd/ 347
METRIC RANK
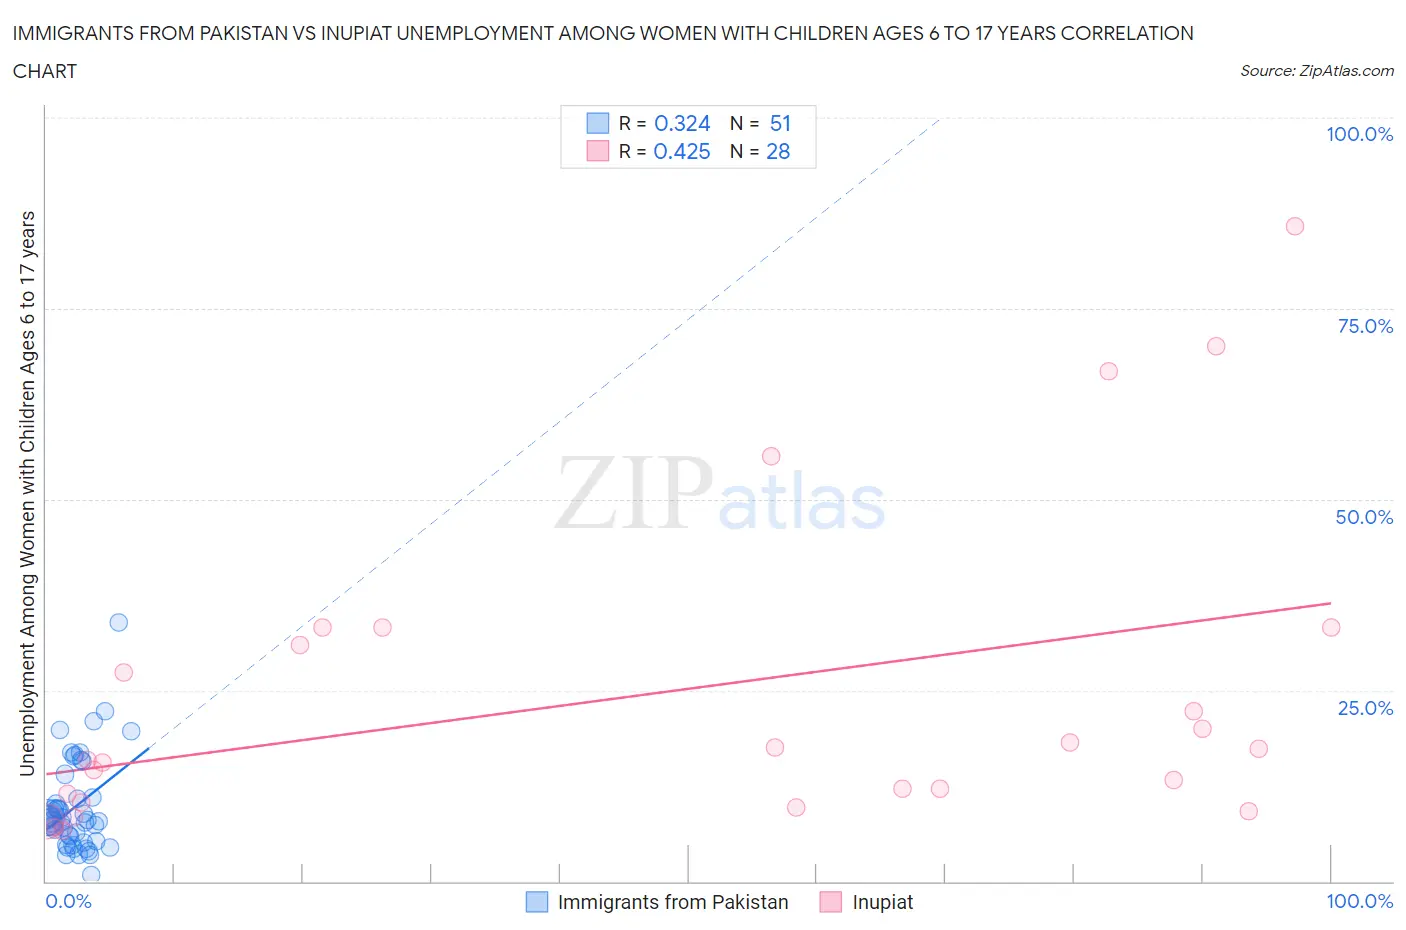
Immigrants from Pakistan vs Inupiat Unemployment Among Women with Children Ages 6 to 17 years Correlation Chart
The statistical analysis conducted on geographies consisting of 220,163,438 people shows a mild positive correlation between the proportion of Immigrants from Pakistan and unemployment rate among women with children between the ages 6 and 17 in the United States with a correlation coefficient (R) of 0.324 and weighted average of 8.6%. Similarly, the statistical analysis conducted on geographies consisting of 85,509,455 people shows a moderate positive correlation between the proportion of Inupiat and unemployment rate among women with children between the ages 6 and 17 in the United States with a correlation coefficient (R) of 0.425 and weighted average of 14.9%, a difference of 73.6%.
Unemployment Among Women with Children Ages 6 to 17 years Correlation Summary
| Measurement | Immigrants from Pakistan | Inupiat |
| Minimum | 0.80% | 6.5% |
| Maximum | 33.8% | 85.7% |
| Range | 33.0% | 79.2% |
| Mean | 9.7% | 24.5% |
| Median | 8.0% | 16.6% |
| Interquartile 25% (IQ1) | 5.3% | 10.8% |
| Interquartile 75% (IQ3) | 11.0% | 32.2% |
| Interquartile Range (IQR) | 5.7% | 21.3% |
| Standard Deviation (Sample) | 6.1% | 20.8% |
| Standard Deviation (Population) | 6.1% | 20.4% |
Similar Demographics by Unemployment Among Women with Children Ages 6 to 17 years
Demographics Similar to Immigrants from Pakistan by Unemployment Among Women with Children Ages 6 to 17 years
In terms of unemployment among women with children ages 6 to 17 years, the demographic groups most similar to Immigrants from Pakistan are Immigrants from Lithuania (8.6%, a difference of 0.0%), New Zealander (8.6%, a difference of 0.0%), Immigrants from South Africa (8.6%, a difference of 0.020%), Scandinavian (8.6%, a difference of 0.030%), and Malaysian (8.6%, a difference of 0.080%).
| Demographics | Rating | Rank | Unemployment Among Women with Children Ages 6 to 17 years |
| Immigrants | Barbados | 98.8 /100 | #94 | Exceptional 8.5% |
| Sri Lankans | 98.7 /100 | #95 | Exceptional 8.5% |
| German Russians | 98.6 /100 | #96 | Exceptional 8.5% |
| Bolivians | 98.5 /100 | #97 | Exceptional 8.5% |
| Malaysians | 98.5 /100 | #98 | Exceptional 8.6% |
| Immigrants | Lithuania | 98.4 /100 | #99 | Exceptional 8.6% |
| New Zealanders | 98.4 /100 | #100 | Exceptional 8.6% |
| Immigrants | Pakistan | 98.4 /100 | #101 | Exceptional 8.6% |
| Immigrants | South Africa | 98.3 /100 | #102 | Exceptional 8.6% |
| Scandinavians | 98.3 /100 | #103 | Exceptional 8.6% |
| Immigrants | France | 98.0 /100 | #104 | Exceptional 8.6% |
| Immigrants | Norway | 97.8 /100 | #105 | Exceptional 8.6% |
| Immigrants | Serbia | 97.7 /100 | #106 | Exceptional 8.6% |
| Chickasaw | 97.6 /100 | #107 | Exceptional 8.6% |
| Swedes | 97.6 /100 | #108 | Exceptional 8.6% |
Demographics Similar to Inupiat by Unemployment Among Women with Children Ages 6 to 17 years
In terms of unemployment among women with children ages 6 to 17 years, the demographic groups most similar to Inupiat are Yuman (14.8%, a difference of 0.29%), Navajo (14.2%, a difference of 4.9%), Puerto Rican (13.9%, a difference of 7.1%), Cheyenne (16.4%, a difference of 10.3%), and Sioux (13.2%, a difference of 12.2%).
| Demographics | Rating | Rank | Unemployment Among Women with Children Ages 6 to 17 years |
| Natives/Alaskans | 0.0 /100 | #333 | Tragic 11.5% |
| Ugandans | 0.0 /100 | #334 | Tragic 12.0% |
| Colville | 0.0 /100 | #335 | Tragic 12.3% |
| Houma | 0.0 /100 | #336 | Tragic 12.5% |
| Immigrants | Yemen | 0.0 /100 | #337 | Tragic 12.7% |
| Hopi | 0.0 /100 | #338 | Tragic 12.9% |
| Sioux | 0.0 /100 | #339 | Tragic 13.2% |
| Puerto Ricans | 0.0 /100 | #340 | Tragic 13.9% |
| Navajo | 0.0 /100 | #341 | Tragic 14.2% |
| Yuman | 0.0 /100 | #342 | Tragic 14.8% |
| Inupiat | 0.0 /100 | #343 | Tragic 14.9% |
| Cheyenne | 0.0 /100 | #344 | Tragic 16.4% |
| Arapaho | 0.0 /100 | #345 | Tragic 16.8% |
| Yup'ik | 0.0 /100 | #346 | Tragic 18.6% |
| Pima | 0.0 /100 | #347 | Tragic 18.9% |