Delaware vs Immigrants from Venezuela Male Unemployment
COMPARE
Delaware
Immigrants from Venezuela
Male Unemployment
Male Unemployment Comparison
Delaware
Immigrants from Venezuela
5.5%
MALE UNEMPLOYMENT
4.2/ 100
METRIC RATING
217th/ 347
METRIC RANK
4.4%
MALE UNEMPLOYMENT
100.0/ 100
METRIC RATING
4th/ 347
METRIC RANK
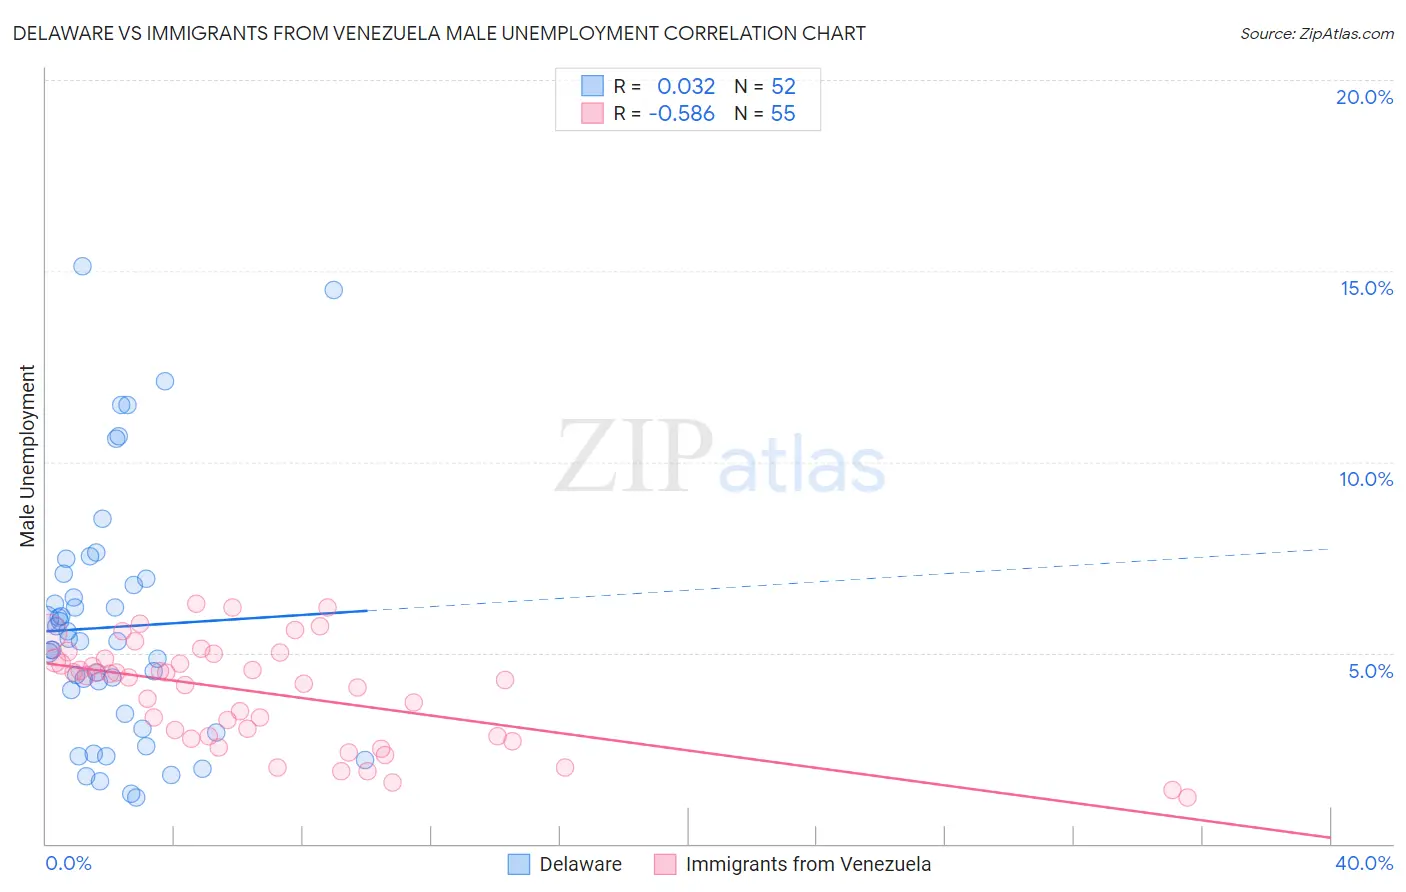
Delaware vs Immigrants from Venezuela Male Unemployment Correlation Chart
The statistical analysis conducted on geographies consisting of 96,069,149 people shows no correlation between the proportion of Delaware and unemployment rate among males in the United States with a correlation coefficient (R) of 0.032 and weighted average of 5.5%. Similarly, the statistical analysis conducted on geographies consisting of 287,397,885 people shows a substantial negative correlation between the proportion of Immigrants from Venezuela and unemployment rate among males in the United States with a correlation coefficient (R) of -0.586 and weighted average of 4.4%, a difference of 24.4%.
Male Unemployment Correlation Summary
| Measurement | Delaware | Immigrants from Venezuela |
| Minimum | 1.2% | 1.2% |
| Maximum | 15.1% | 6.3% |
| Range | 13.9% | 5.1% |
| Mean | 5.7% | 3.9% |
| Median | 5.3% | 4.3% |
| Interquartile 25% (IQ1) | 3.2% | 2.8% |
| Interquartile 75% (IQ3) | 6.8% | 4.9% |
| Interquartile Range (IQR) | 3.6% | 2.1% |
| Standard Deviation (Sample) | 3.3% | 1.3% |
| Standard Deviation (Population) | 3.2% | 1.3% |
Similar Demographics by Male Unemployment
Demographics Similar to Delaware by Male Unemployment
In terms of male unemployment, the demographic groups most similar to Delaware are Immigrants (5.5%, a difference of 0.050%), Immigrants from Albania (5.5%, a difference of 0.21%), Samoan (5.5%, a difference of 0.22%), Immigrants from Western Asia (5.6%, a difference of 0.25%), and Portuguese (5.6%, a difference of 0.28%).
| Demographics | Rating | Rank | Male Unemployment |
| South American Indians | 7.6 /100 | #210 | Tragic 5.5% |
| Israelis | 7.4 /100 | #211 | Tragic 5.5% |
| Hmong | 7.0 /100 | #212 | Tragic 5.5% |
| Ugandans | 6.3 /100 | #213 | Tragic 5.5% |
| Puget Sound Salish | 5.6 /100 | #214 | Tragic 5.5% |
| Samoans | 4.9 /100 | #215 | Tragic 5.5% |
| Immigrants | Immigrants | 4.3 /100 | #216 | Tragic 5.5% |
| Delaware | 4.2 /100 | #217 | Tragic 5.5% |
| Immigrants | Albania | 3.6 /100 | #218 | Tragic 5.5% |
| Immigrants | Western Asia | 3.5 /100 | #219 | Tragic 5.6% |
| Portuguese | 3.5 /100 | #220 | Tragic 5.6% |
| Soviet Union | 3.2 /100 | #221 | Tragic 5.6% |
| Immigrants | Micronesia | 2.9 /100 | #222 | Tragic 5.6% |
| Creek | 2.6 /100 | #223 | Tragic 5.6% |
| Cherokee | 2.4 /100 | #224 | Tragic 5.6% |
Demographics Similar to Immigrants from Venezuela by Male Unemployment
In terms of male unemployment, the demographic groups most similar to Immigrants from Venezuela are Norwegian (4.4%, a difference of 0.33%), Immigrants from Cuba (4.4%, a difference of 0.58%), Danish (4.5%, a difference of 1.0%), Venezuelan (4.5%, a difference of 1.5%), and Immigrants from India (4.4%, a difference of 1.7%).
| Demographics | Rating | Rank | Male Unemployment |
| Immigrants | India | 100.0 /100 | #1 | Exceptional 4.4% |
| Immigrants | Cuba | 100.0 /100 | #2 | Exceptional 4.4% |
| Norwegians | 100.0 /100 | #3 | Exceptional 4.4% |
| Immigrants | Venezuela | 100.0 /100 | #4 | Exceptional 4.4% |
| Danes | 100.0 /100 | #5 | Exceptional 4.5% |
| Venezuelans | 100.0 /100 | #6 | Exceptional 4.5% |
| Czechs | 100.0 /100 | #7 | Exceptional 4.5% |
| Luxembourgers | 100.0 /100 | #8 | Exceptional 4.5% |
| Thais | 100.0 /100 | #9 | Exceptional 4.6% |
| Cubans | 100.0 /100 | #10 | Exceptional 4.6% |
| Swedes | 100.0 /100 | #11 | Exceptional 4.6% |
| Immigrants | Bolivia | 100.0 /100 | #12 | Exceptional 4.7% |
| Bolivians | 100.0 /100 | #13 | Exceptional 4.7% |
| Germans | 100.0 /100 | #14 | Exceptional 4.7% |
| Scandinavians | 100.0 /100 | #15 | Exceptional 4.7% |