Czechoslovakian vs Blackfeet Male Unemployment
COMPARE
Czechoslovakian
Blackfeet
Male Unemployment
Male Unemployment Comparison
Czechoslovakians
Blackfeet
5.0%
MALE UNEMPLOYMENT
98.7/ 100
METRIC RATING
55th/ 347
METRIC RANK
6.0%
MALE UNEMPLOYMENT
0.0/ 100
METRIC RATING
271st/ 347
METRIC RANK
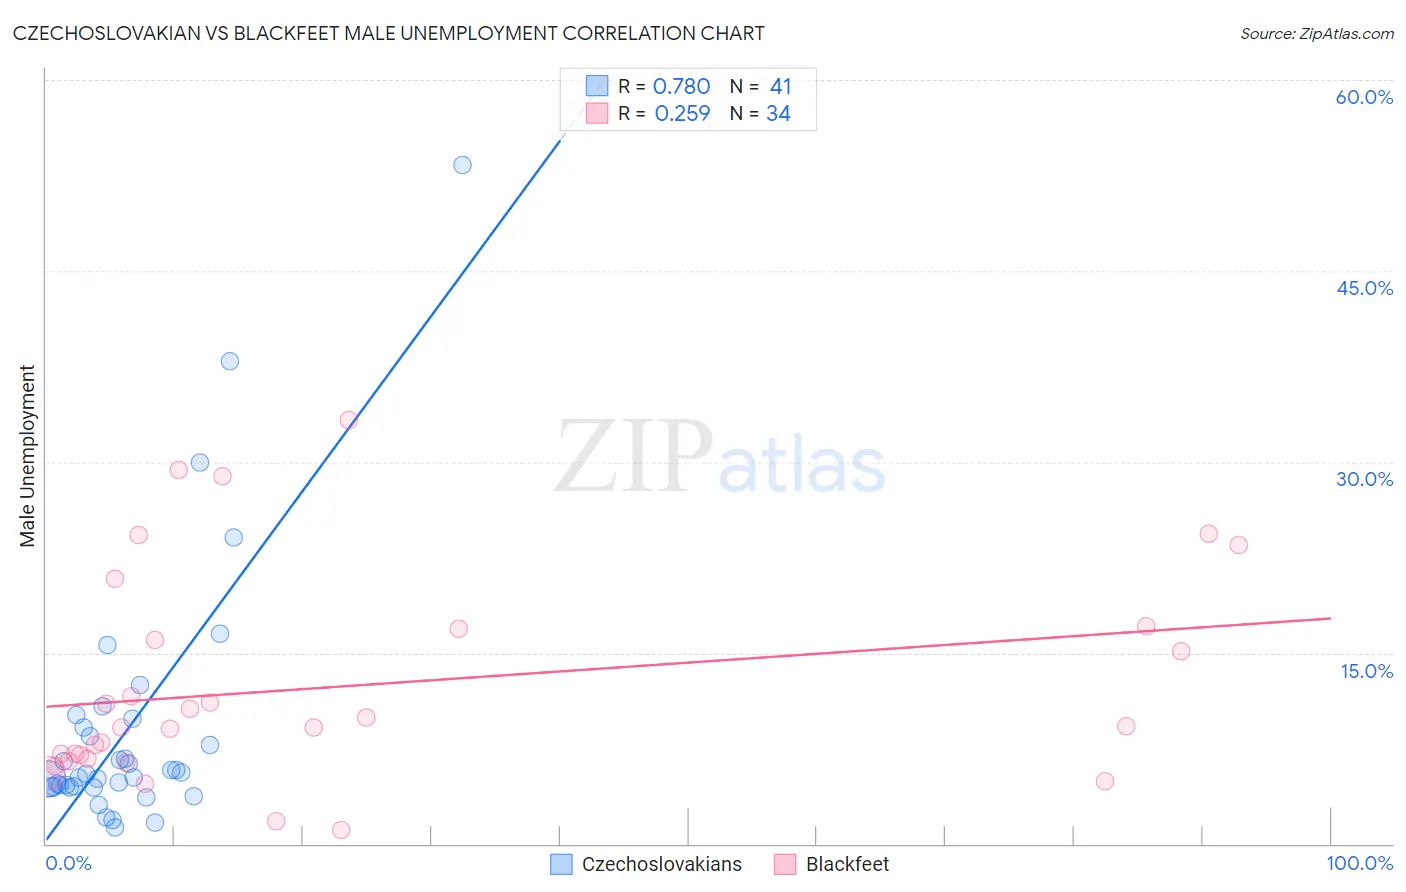
Czechoslovakian vs Blackfeet Male Unemployment Correlation Chart
The statistical analysis conducted on geographies consisting of 366,692,431 people shows a strong positive correlation between the proportion of Czechoslovakians and unemployment rate among males in the United States with a correlation coefficient (R) of 0.780 and weighted average of 5.0%. Similarly, the statistical analysis conducted on geographies consisting of 308,278,150 people shows a weak positive correlation between the proportion of Blackfeet and unemployment rate among males in the United States with a correlation coefficient (R) of 0.259 and weighted average of 6.0%, a difference of 20.8%.
Male Unemployment Correlation Summary
| Measurement | Czechoslovakian | Blackfeet |
| Minimum | 1.3% | 1.1% |
| Maximum | 53.3% | 33.3% |
| Range | 52.0% | 32.2% |
| Mean | 9.1% | 12.4% |
| Median | 5.5% | 9.2% |
| Interquartile 25% (IQ1) | 4.5% | 6.7% |
| Interquartile 75% (IQ3) | 9.5% | 16.9% |
| Interquartile Range (IQR) | 5.1% | 10.2% |
| Standard Deviation (Sample) | 10.2% | 8.3% |
| Standard Deviation (Population) | 10.1% | 8.2% |
Similar Demographics by Male Unemployment
Demographics Similar to Czechoslovakians by Male Unemployment
In terms of male unemployment, the demographic groups most similar to Czechoslovakians are Yugoslavian (5.0%, a difference of 0.0%), Immigrants from Bulgaria (5.0%, a difference of 0.0%), Jordanian (5.0%, a difference of 0.11%), Irish (5.0%, a difference of 0.17%), and Slovene (5.0%, a difference of 0.19%).
| Demographics | Rating | Rank | Male Unemployment |
| Immigrants | Scotland | 98.9 /100 | #48 | Exceptional 4.9% |
| Poles | 98.9 /100 | #49 | Exceptional 4.9% |
| Croatians | 98.9 /100 | #50 | Exceptional 4.9% |
| Slovenes | 98.8 /100 | #51 | Exceptional 5.0% |
| Irish | 98.8 /100 | #52 | Exceptional 5.0% |
| Jordanians | 98.8 /100 | #53 | Exceptional 5.0% |
| Yugoslavians | 98.7 /100 | #54 | Exceptional 5.0% |
| Czechoslovakians | 98.7 /100 | #55 | Exceptional 5.0% |
| Immigrants | Bulgaria | 98.7 /100 | #56 | Exceptional 5.0% |
| Turks | 98.5 /100 | #57 | Exceptional 5.0% |
| Lithuanians | 98.5 /100 | #58 | Exceptional 5.0% |
| Immigrants | Netherlands | 98.3 /100 | #59 | Exceptional 5.0% |
| Immigrants | Argentina | 98.1 /100 | #60 | Exceptional 5.0% |
| Cambodians | 98.1 /100 | #61 | Exceptional 5.0% |
| Basques | 97.9 /100 | #62 | Exceptional 5.0% |
Demographics Similar to Blackfeet by Male Unemployment
In terms of male unemployment, the demographic groups most similar to Blackfeet are Immigrants from Uzbekistan (6.0%, a difference of 0.23%), Armenian (6.0%, a difference of 0.24%), Immigrants from Sierra Leone (6.0%, a difference of 0.41%), Subsaharan African (6.0%, a difference of 0.50%), and Menominee (6.0%, a difference of 0.57%).
| Demographics | Rating | Rank | Male Unemployment |
| Immigrants | Mexico | 0.0 /100 | #264 | Tragic 5.9% |
| French American Indians | 0.0 /100 | #265 | Tragic 5.9% |
| Bahamians | 0.0 /100 | #266 | Tragic 5.9% |
| Nigerians | 0.0 /100 | #267 | Tragic 5.9% |
| Bermudans | 0.0 /100 | #268 | Tragic 5.9% |
| Immigrants | Nigeria | 0.0 /100 | #269 | Tragic 6.0% |
| Sub-Saharan Africans | 0.0 /100 | #270 | Tragic 6.0% |
| Blackfeet | 0.0 /100 | #271 | Tragic 6.0% |
| Immigrants | Uzbekistan | 0.0 /100 | #272 | Tragic 6.0% |
| Armenians | 0.0 /100 | #273 | Tragic 6.0% |
| Immigrants | Sierra Leone | 0.0 /100 | #274 | Tragic 6.0% |
| Menominee | 0.0 /100 | #275 | Tragic 6.0% |
| Tlingit-Haida | 0.0 /100 | #276 | Tragic 6.0% |
| Immigrants | Liberia | 0.0 /100 | #277 | Tragic 6.1% |
| Immigrants | Fiji | 0.0 /100 | #278 | Tragic 6.1% |