Lebanese vs Immigrants from Bolivia Female Unemployment
COMPARE
Lebanese
Immigrants from Bolivia
Female Unemployment
Female Unemployment Comparison
Lebanese
Immigrants from Bolivia
5.1%
FEMALE UNEMPLOYMENT
91.0/ 100
METRIC RATING
115th/ 347
METRIC RANK
5.0%
FEMALE UNEMPLOYMENT
98.0/ 100
METRIC RATING
74th/ 347
METRIC RANK
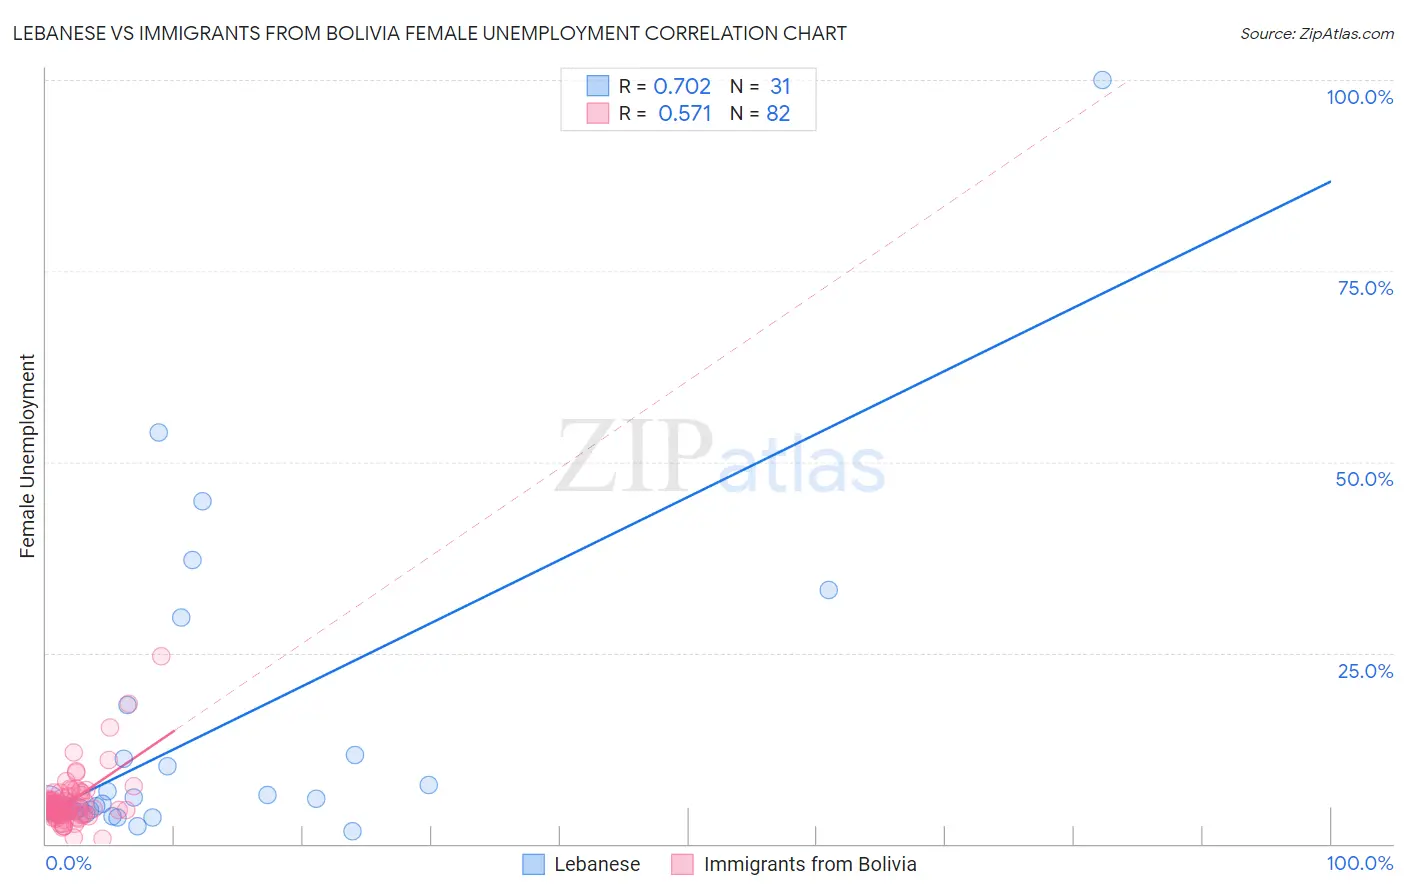
Lebanese vs Immigrants from Bolivia Female Unemployment Correlation Chart
The statistical analysis conducted on geographies consisting of 399,531,813 people shows a strong positive correlation between the proportion of Lebanese and unemploymnet rate among females in the United States with a correlation coefficient (R) of 0.702 and weighted average of 5.1%. Similarly, the statistical analysis conducted on geographies consisting of 158,575,090 people shows a substantial positive correlation between the proportion of Immigrants from Bolivia and unemploymnet rate among females in the United States with a correlation coefficient (R) of 0.571 and weighted average of 5.0%, a difference of 2.5%.
Female Unemployment Correlation Summary
| Measurement | Lebanese | Immigrants from Bolivia |
| Minimum | 1.6% | 0.67% |
| Maximum | 100.0% | 24.5% |
| Range | 98.4% | 23.8% |
| Mean | 14.5% | 5.5% |
| Median | 5.2% | 4.8% |
| Interquartile 25% (IQ1) | 4.4% | 3.9% |
| Interquartile 75% (IQ3) | 11.6% | 5.7% |
| Interquartile Range (IQR) | 7.2% | 1.8% |
| Standard Deviation (Sample) | 20.8% | 3.4% |
| Standard Deviation (Population) | 20.5% | 3.4% |
Similar Demographics by Female Unemployment
Demographics Similar to Lebanese by Female Unemployment
In terms of female unemployment, the demographic groups most similar to Lebanese are Immigrants from Turkey (5.1%, a difference of 0.020%), Immigrants from Saudi Arabia (5.1%, a difference of 0.050%), American (5.1%, a difference of 0.080%), Jordanian (5.1%, a difference of 0.12%), and Immigrants from Croatia (5.1%, a difference of 0.18%).
| Demographics | Rating | Rank | Female Unemployment |
| Puget Sound Salish | 93.0 /100 | #108 | Exceptional 5.1% |
| Immigrants | Eastern Africa | 92.8 /100 | #109 | Exceptional 5.1% |
| Macedonians | 92.4 /100 | #110 | Exceptional 5.1% |
| Immigrants | Burma/Myanmar | 92.3 /100 | #111 | Exceptional 5.1% |
| Estonians | 92.1 /100 | #112 | Exceptional 5.1% |
| Immigrants | Saudi Arabia | 91.2 /100 | #113 | Exceptional 5.1% |
| Immigrants | Turkey | 91.0 /100 | #114 | Exceptional 5.1% |
| Lebanese | 91.0 /100 | #115 | Exceptional 5.1% |
| Americans | 90.5 /100 | #116 | Exceptional 5.1% |
| Jordanians | 90.3 /100 | #117 | Exceptional 5.1% |
| Immigrants | Croatia | 89.9 /100 | #118 | Excellent 5.1% |
| Immigrants | North Macedonia | 88.3 /100 | #119 | Excellent 5.1% |
| Immigrants | Romania | 88.1 /100 | #120 | Excellent 5.1% |
| Immigrants | Western Europe | 88.1 /100 | #121 | Excellent 5.1% |
| Immigrants | Germany | 87.6 /100 | #122 | Excellent 5.1% |
Demographics Similar to Immigrants from Bolivia by Female Unemployment
In terms of female unemployment, the demographic groups most similar to Immigrants from Bolivia are Russian (5.0%, a difference of 0.010%), Immigrants from Singapore (5.0%, a difference of 0.020%), Immigrants from Venezuela (5.0%, a difference of 0.030%), Immigrants from Northern Europe (4.9%, a difference of 0.040%), and German Russian (4.9%, a difference of 0.11%).
| Demographics | Rating | Rank | Female Unemployment |
| Cubans | 98.3 /100 | #67 | Exceptional 4.9% |
| Tlingit-Haida | 98.3 /100 | #68 | Exceptional 4.9% |
| Immigrants | Ireland | 98.2 /100 | #69 | Exceptional 4.9% |
| Osage | 98.2 /100 | #70 | Exceptional 4.9% |
| German Russians | 98.1 /100 | #71 | Exceptional 4.9% |
| Immigrants | Northern Europe | 98.0 /100 | #72 | Exceptional 4.9% |
| Russians | 98.0 /100 | #73 | Exceptional 5.0% |
| Immigrants | Bolivia | 98.0 /100 | #74 | Exceptional 5.0% |
| Immigrants | Singapore | 98.0 /100 | #75 | Exceptional 5.0% |
| Immigrants | Venezuela | 97.9 /100 | #76 | Exceptional 5.0% |
| Mongolians | 97.8 /100 | #77 | Exceptional 5.0% |
| Immigrants | Netherlands | 97.8 /100 | #78 | Exceptional 5.0% |
| Turks | 97.6 /100 | #79 | Exceptional 5.0% |
| New Zealanders | 97.4 /100 | #80 | Exceptional 5.0% |
| Filipinos | 97.3 /100 | #81 | Exceptional 5.0% |