Cree vs Paiute Unemployment Among Women with Children Under 6 years
COMPARE
Cree
Paiute
Unemployment Among Women with Children Under 6 years
Unemployment Among Women with Children Under 6 years Comparison
Cree
Paiute
7.6%
UNEMPLOYMENT AMONG WOMEN WITH CHILDREN UNDER 6 YEARS
51.6/ 100
METRIC RATING
173rd/ 347
METRIC RANK
9.7%
UNEMPLOYMENT AMONG WOMEN WITH CHILDREN UNDER 6 YEARS
0.0/ 100
METRIC RATING
324th/ 347
METRIC RANK
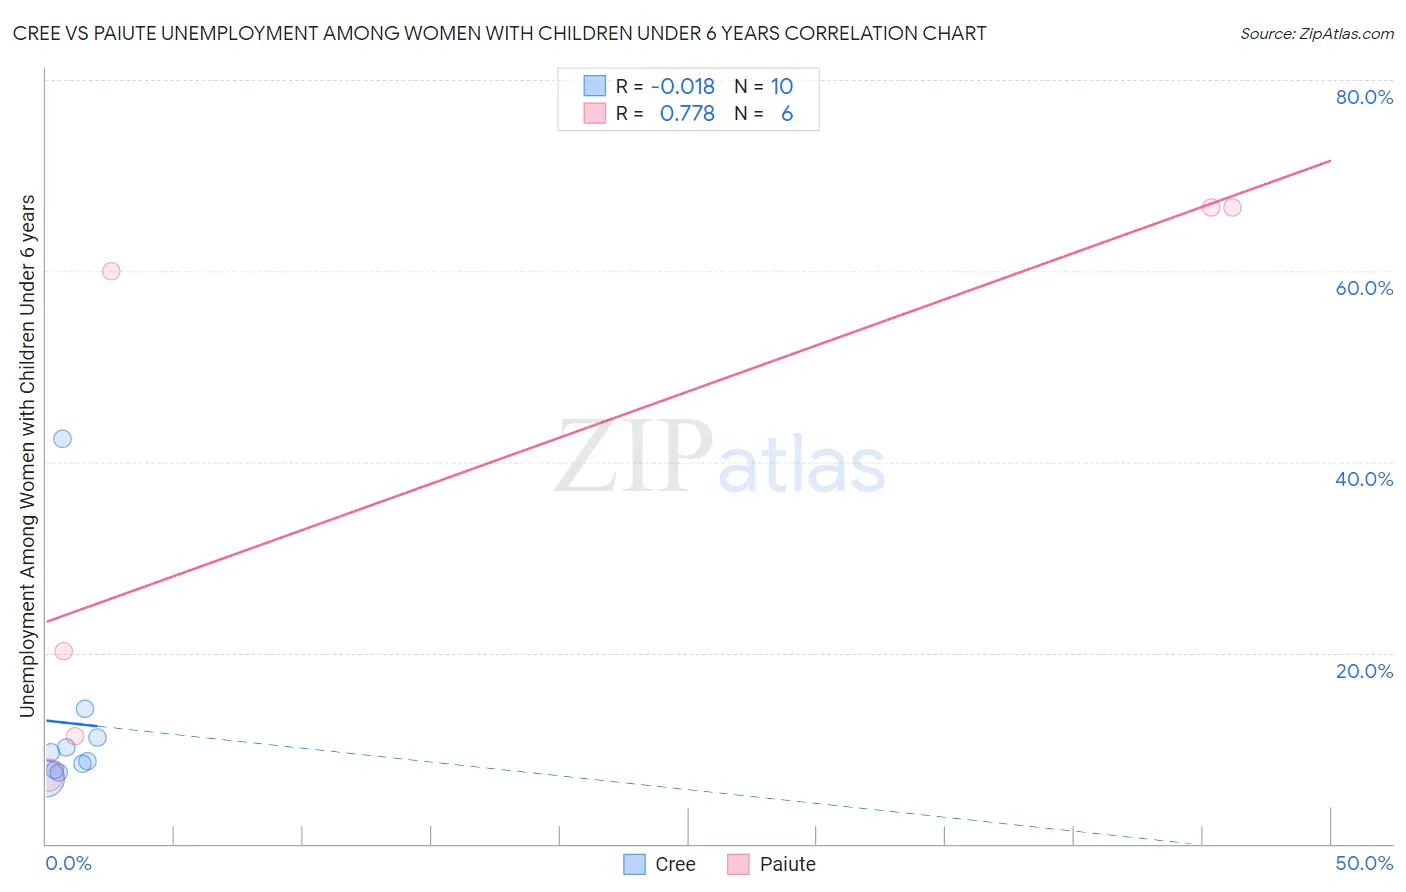
Cree vs Paiute Unemployment Among Women with Children Under 6 years Correlation Chart
The statistical analysis conducted on geographies consisting of 69,437,717 people shows no correlation between the proportion of Cree and unemployment rate among women with children under the age of 6 in the United States with a correlation coefficient (R) of -0.018 and weighted average of 7.6%. Similarly, the statistical analysis conducted on geographies consisting of 54,107,424 people shows a strong positive correlation between the proportion of Paiute and unemployment rate among women with children under the age of 6 in the United States with a correlation coefficient (R) of 0.778 and weighted average of 9.7%, a difference of 27.0%.
Unemployment Among Women with Children Under 6 years Correlation Summary
| Measurement | Cree | Paiute |
| Minimum | 6.8% | 7.2% |
| Maximum | 42.4% | 66.7% |
| Range | 35.6% | 59.5% |
| Mean | 12.6% | 38.7% |
| Median | 9.1% | 40.1% |
| Interquartile 25% (IQ1) | 7.8% | 11.3% |
| Interquartile 75% (IQ3) | 11.2% | 66.7% |
| Interquartile Range (IQR) | 3.4% | 55.4% |
| Standard Deviation (Sample) | 10.7% | 28.7% |
| Standard Deviation (Population) | 10.1% | 26.2% |
Similar Demographics by Unemployment Among Women with Children Under 6 years
Demographics Similar to Cree by Unemployment Among Women with Children Under 6 years
In terms of unemployment among women with children under 6 years, the demographic groups most similar to Cree are Immigrants from Laos (7.6%, a difference of 0.11%), Panamanian (7.6%, a difference of 0.13%), Puget Sound Salish (7.7%, a difference of 0.26%), Austrian (7.7%, a difference of 0.37%), and Immigrants from North America (7.6%, a difference of 0.41%).
| Demographics | Rating | Rank | Unemployment Among Women with Children Under 6 years |
| Belgians | 63.5 /100 | #166 | Good 7.6% |
| Kenyans | 62.5 /100 | #167 | Good 7.6% |
| Immigrants | Canada | 61.6 /100 | #168 | Good 7.6% |
| Immigrants | Scotland | 61.3 /100 | #169 | Good 7.6% |
| Czechs | 59.8 /100 | #170 | Average 7.6% |
| Immigrants | Grenada | 59.0 /100 | #171 | Average 7.6% |
| Immigrants | North America | 57.7 /100 | #172 | Average 7.6% |
| Cree | 51.6 /100 | #173 | Average 7.6% |
| Immigrants | Laos | 50.0 /100 | #174 | Average 7.6% |
| Panamanians | 49.6 /100 | #175 | Average 7.6% |
| Puget Sound Salish | 47.7 /100 | #176 | Average 7.7% |
| Austrians | 46.0 /100 | #177 | Average 7.7% |
| Immigrants | England | 45.4 /100 | #178 | Average 7.7% |
| Immigrants | Western Europe | 44.9 /100 | #179 | Average 7.7% |
| Immigrants | Uruguay | 44.5 /100 | #180 | Average 7.7% |
Demographics Similar to Paiute by Unemployment Among Women with Children Under 6 years
In terms of unemployment among women with children under 6 years, the demographic groups most similar to Paiute are Immigrants from Bahamas (9.6%, a difference of 0.70%), Alaska Native (9.6%, a difference of 0.89%), Choctaw (9.8%, a difference of 0.95%), Delaware (9.8%, a difference of 0.98%), and Central American Indian (9.6%, a difference of 1.1%).
| Demographics | Rating | Rank | Unemployment Among Women with Children Under 6 years |
| Dutch West Indians | 0.0 /100 | #317 | Tragic 9.5% |
| Osage | 0.0 /100 | #318 | Tragic 9.5% |
| Marshallese | 0.0 /100 | #319 | Tragic 9.6% |
| Potawatomi | 0.0 /100 | #320 | Tragic 9.6% |
| Central American Indians | 0.0 /100 | #321 | Tragic 9.6% |
| Alaska Natives | 0.0 /100 | #322 | Tragic 9.6% |
| Immigrants | Bahamas | 0.0 /100 | #323 | Tragic 9.6% |
| Paiute | 0.0 /100 | #324 | Tragic 9.7% |
| Choctaw | 0.0 /100 | #325 | Tragic 9.8% |
| Delaware | 0.0 /100 | #326 | Tragic 9.8% |
| Ottawa | 0.0 /100 | #327 | Tragic 9.9% |
| Tohono O'odham | 0.0 /100 | #328 | Tragic 10.2% |
| Blacks/African Americans | 0.0 /100 | #329 | Tragic 10.3% |
| Pennsylvania Germans | 0.0 /100 | #330 | Tragic 10.8% |
| Colville | 0.0 /100 | #331 | Tragic 11.2% |