Cree vs Tlingit-Haida Unemployment Among Women with Children Under 6 years
COMPARE
Cree
Tlingit-Haida
Unemployment Among Women with Children Under 6 years
Unemployment Among Women with Children Under 6 years Comparison
Cree
Tlingit-Haida
7.6%
UNEMPLOYMENT AMONG WOMEN WITH CHILDREN UNDER 6 YEARS
51.6/ 100
METRIC RATING
173rd/ 347
METRIC RANK
8.9%
UNEMPLOYMENT AMONG WOMEN WITH CHILDREN UNDER 6 YEARS
0.0/ 100
METRIC RATING
298th/ 347
METRIC RANK
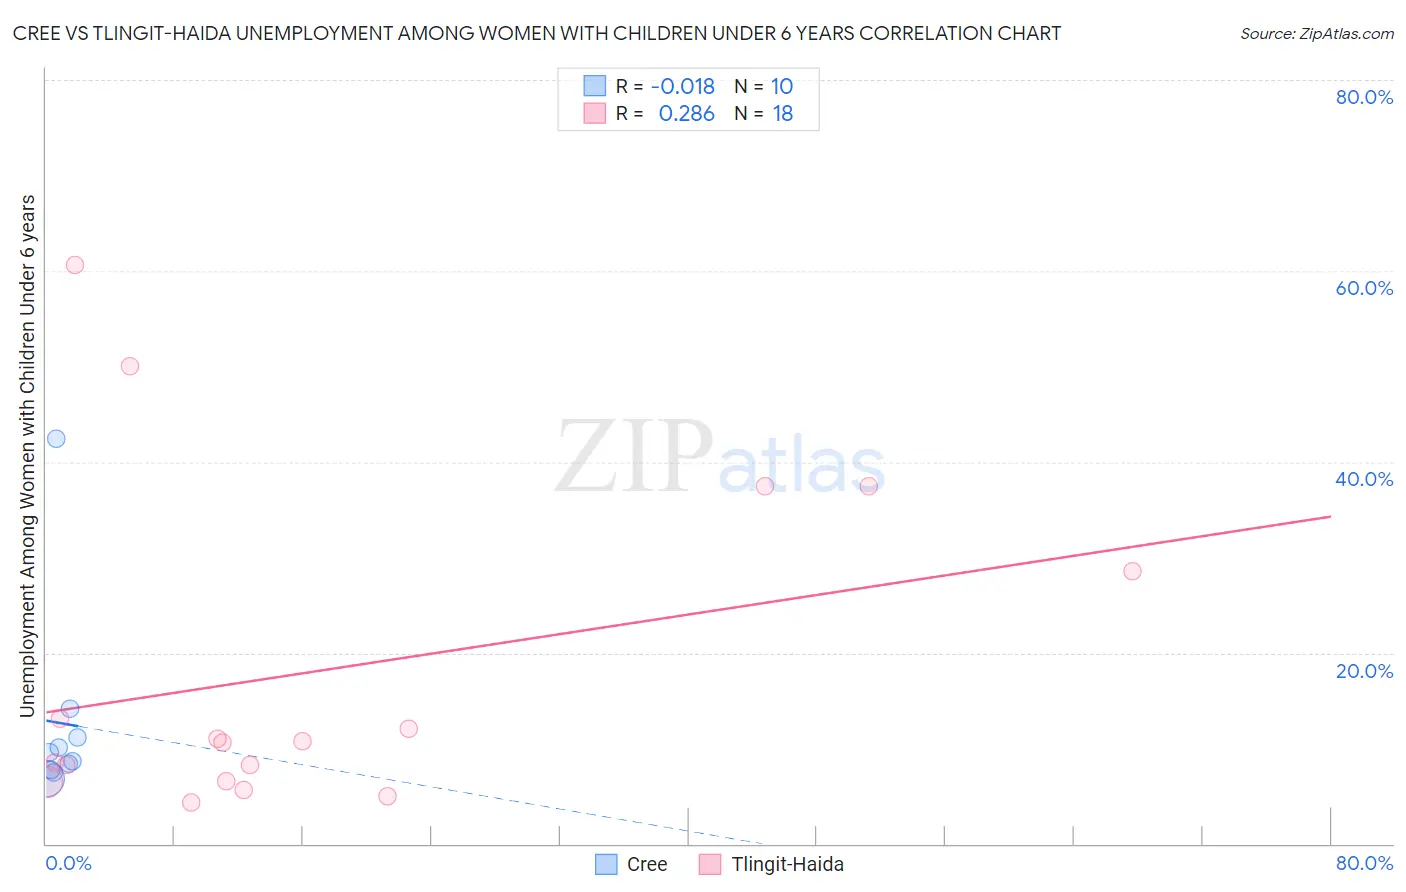
Cree vs Tlingit-Haida Unemployment Among Women with Children Under 6 years Correlation Chart
The statistical analysis conducted on geographies consisting of 69,437,717 people shows no correlation between the proportion of Cree and unemployment rate among women with children under the age of 6 in the United States with a correlation coefficient (R) of -0.018 and weighted average of 7.6%. Similarly, the statistical analysis conducted on geographies consisting of 54,546,632 people shows a weak positive correlation between the proportion of Tlingit-Haida and unemployment rate among women with children under the age of 6 in the United States with a correlation coefficient (R) of 0.286 and weighted average of 8.9%, a difference of 16.4%.
Unemployment Among Women with Children Under 6 years Correlation Summary
| Measurement | Cree | Tlingit-Haida |
| Minimum | 6.8% | 4.3% |
| Maximum | 42.4% | 60.7% |
| Range | 35.6% | 56.4% |
| Mean | 12.6% | 18.0% |
| Median | 9.1% | 10.6% |
| Interquartile 25% (IQ1) | 7.8% | 6.5% |
| Interquartile 75% (IQ3) | 11.2% | 28.6% |
| Interquartile Range (IQR) | 3.4% | 22.1% |
| Standard Deviation (Sample) | 10.7% | 17.1% |
| Standard Deviation (Population) | 10.1% | 16.6% |
Similar Demographics by Unemployment Among Women with Children Under 6 years
Demographics Similar to Cree by Unemployment Among Women with Children Under 6 years
In terms of unemployment among women with children under 6 years, the demographic groups most similar to Cree are Immigrants from Laos (7.6%, a difference of 0.11%), Panamanian (7.6%, a difference of 0.13%), Puget Sound Salish (7.7%, a difference of 0.26%), Austrian (7.7%, a difference of 0.37%), and Immigrants from North America (7.6%, a difference of 0.41%).
| Demographics | Rating | Rank | Unemployment Among Women with Children Under 6 years |
| Belgians | 63.5 /100 | #166 | Good 7.6% |
| Kenyans | 62.5 /100 | #167 | Good 7.6% |
| Immigrants | Canada | 61.6 /100 | #168 | Good 7.6% |
| Immigrants | Scotland | 61.3 /100 | #169 | Good 7.6% |
| Czechs | 59.8 /100 | #170 | Average 7.6% |
| Immigrants | Grenada | 59.0 /100 | #171 | Average 7.6% |
| Immigrants | North America | 57.7 /100 | #172 | Average 7.6% |
| Cree | 51.6 /100 | #173 | Average 7.6% |
| Immigrants | Laos | 50.0 /100 | #174 | Average 7.6% |
| Panamanians | 49.6 /100 | #175 | Average 7.6% |
| Puget Sound Salish | 47.7 /100 | #176 | Average 7.7% |
| Austrians | 46.0 /100 | #177 | Average 7.7% |
| Immigrants | England | 45.4 /100 | #178 | Average 7.7% |
| Immigrants | Western Europe | 44.9 /100 | #179 | Average 7.7% |
| Immigrants | Uruguay | 44.5 /100 | #180 | Average 7.7% |
Demographics Similar to Tlingit-Haida by Unemployment Among Women with Children Under 6 years
In terms of unemployment among women with children under 6 years, the demographic groups most similar to Tlingit-Haida are Mexican (8.9%, a difference of 0.16%), Immigrants from Jamaica (8.9%, a difference of 0.21%), Immigrants from Dominican Republic (8.9%, a difference of 0.25%), Creek (8.9%, a difference of 0.30%), and Immigrants from Central America (8.9%, a difference of 0.39%).
| Demographics | Rating | Rank | Unemployment Among Women with Children Under 6 years |
| Jamaicans | 0.0 /100 | #291 | Tragic 8.8% |
| Cheyenne | 0.0 /100 | #292 | Tragic 8.8% |
| Immigrants | Bangladesh | 0.0 /100 | #293 | Tragic 8.8% |
| Immigrants | Nonimmigrants | 0.0 /100 | #294 | Tragic 8.8% |
| Immigrants | Central America | 0.0 /100 | #295 | Tragic 8.9% |
| Immigrants | Dominican Republic | 0.0 /100 | #296 | Tragic 8.9% |
| Mexicans | 0.0 /100 | #297 | Tragic 8.9% |
| Tlingit-Haida | 0.0 /100 | #298 | Tragic 8.9% |
| Immigrants | Jamaica | 0.0 /100 | #299 | Tragic 8.9% |
| Creek | 0.0 /100 | #300 | Tragic 8.9% |
| Chickasaw | 0.0 /100 | #301 | Tragic 9.0% |
| Hispanics or Latinos | 0.0 /100 | #302 | Tragic 9.0% |
| Immigrants | West Indies | 0.0 /100 | #303 | Tragic 9.0% |
| Immigrants | Mexico | 0.0 /100 | #304 | Tragic 9.1% |
| Alaskan Athabascans | 0.0 /100 | #305 | Tragic 9.1% |