Cree vs Immigrants from Kuwait Unemployment Among Women with Children Under 6 years
COMPARE
Cree
Immigrants from Kuwait
Unemployment Among Women with Children Under 6 years
Unemployment Among Women with Children Under 6 years Comparison
Cree
Immigrants from Kuwait
7.6%
UNEMPLOYMENT AMONG WOMEN WITH CHILDREN UNDER 6 YEARS
51.6/ 100
METRIC RATING
173rd/ 347
METRIC RANK
6.9%
UNEMPLOYMENT AMONG WOMEN WITH CHILDREN UNDER 6 YEARS
99.7/ 100
METRIC RATING
65th/ 347
METRIC RANK
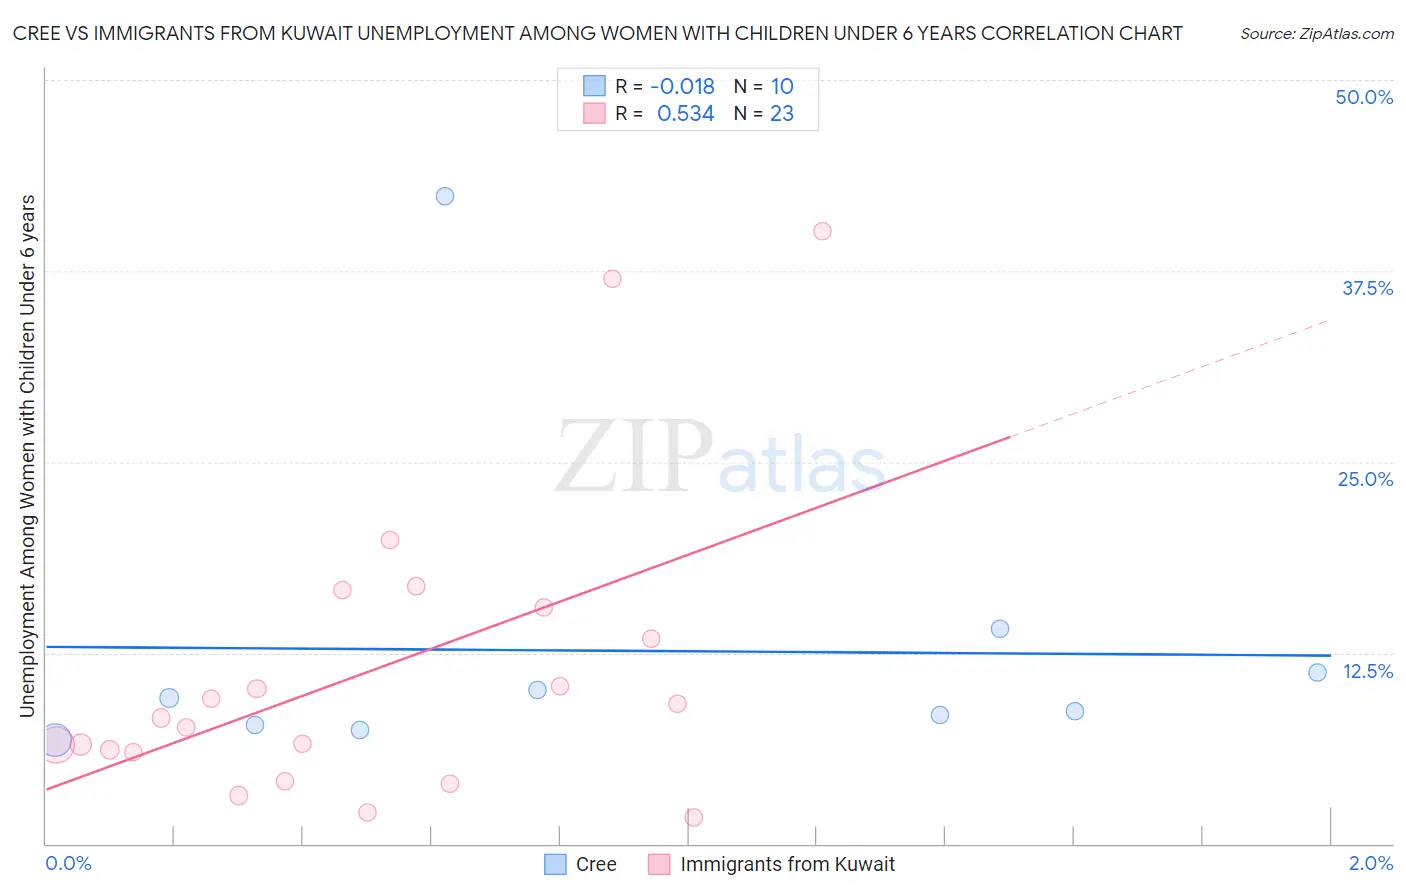
Cree vs Immigrants from Kuwait Unemployment Among Women with Children Under 6 years Correlation Chart
The statistical analysis conducted on geographies consisting of 69,437,717 people shows no correlation between the proportion of Cree and unemployment rate among women with children under the age of 6 in the United States with a correlation coefficient (R) of -0.018 and weighted average of 7.6%. Similarly, the statistical analysis conducted on geographies consisting of 121,724,889 people shows a substantial positive correlation between the proportion of Immigrants from Kuwait and unemployment rate among women with children under the age of 6 in the United States with a correlation coefficient (R) of 0.534 and weighted average of 6.9%, a difference of 10.3%.
Unemployment Among Women with Children Under 6 years Correlation Summary
| Measurement | Cree | Immigrants from Kuwait |
| Minimum | 6.8% | 1.7% |
| Maximum | 42.4% | 40.1% |
| Range | 35.6% | 38.4% |
| Mean | 12.6% | 11.3% |
| Median | 9.1% | 8.2% |
| Interquartile 25% (IQ1) | 7.8% | 6.0% |
| Interquartile 75% (IQ3) | 11.2% | 15.5% |
| Interquartile Range (IQR) | 3.4% | 9.5% |
| Standard Deviation (Sample) | 10.7% | 9.9% |
| Standard Deviation (Population) | 10.1% | 9.7% |
Similar Demographics by Unemployment Among Women with Children Under 6 years
Demographics Similar to Cree by Unemployment Among Women with Children Under 6 years
In terms of unemployment among women with children under 6 years, the demographic groups most similar to Cree are Immigrants from Laos (7.6%, a difference of 0.11%), Panamanian (7.6%, a difference of 0.13%), Puget Sound Salish (7.7%, a difference of 0.26%), Austrian (7.7%, a difference of 0.37%), and Immigrants from North America (7.6%, a difference of 0.41%).
| Demographics | Rating | Rank | Unemployment Among Women with Children Under 6 years |
| Belgians | 63.5 /100 | #166 | Good 7.6% |
| Kenyans | 62.5 /100 | #167 | Good 7.6% |
| Immigrants | Canada | 61.6 /100 | #168 | Good 7.6% |
| Immigrants | Scotland | 61.3 /100 | #169 | Good 7.6% |
| Czechs | 59.8 /100 | #170 | Average 7.6% |
| Immigrants | Grenada | 59.0 /100 | #171 | Average 7.6% |
| Immigrants | North America | 57.7 /100 | #172 | Average 7.6% |
| Cree | 51.6 /100 | #173 | Average 7.6% |
| Immigrants | Laos | 50.0 /100 | #174 | Average 7.6% |
| Panamanians | 49.6 /100 | #175 | Average 7.6% |
| Puget Sound Salish | 47.7 /100 | #176 | Average 7.7% |
| Austrians | 46.0 /100 | #177 | Average 7.7% |
| Immigrants | England | 45.4 /100 | #178 | Average 7.7% |
| Immigrants | Western Europe | 44.9 /100 | #179 | Average 7.7% |
| Immigrants | Uruguay | 44.5 /100 | #180 | Average 7.7% |
Demographics Similar to Immigrants from Kuwait by Unemployment Among Women with Children Under 6 years
In terms of unemployment among women with children under 6 years, the demographic groups most similar to Immigrants from Kuwait are Tongan (6.9%, a difference of 0.15%), Immigrants from Belgium (6.9%, a difference of 0.22%), Maltese (6.9%, a difference of 0.25%), Somali (6.9%, a difference of 0.29%), and Immigrants from France (6.9%, a difference of 0.33%).
| Demographics | Rating | Rank | Unemployment Among Women with Children Under 6 years |
| Immigrants | Turkey | 99.8 /100 | #58 | Exceptional 6.9% |
| Immigrants | Serbia | 99.8 /100 | #59 | Exceptional 6.9% |
| Immigrants | Sri Lanka | 99.8 /100 | #60 | Exceptional 6.9% |
| Immigrants | France | 99.7 /100 | #61 | Exceptional 6.9% |
| Somalis | 99.7 /100 | #62 | Exceptional 6.9% |
| Maltese | 99.7 /100 | #63 | Exceptional 6.9% |
| Tongans | 99.7 /100 | #64 | Exceptional 6.9% |
| Immigrants | Kuwait | 99.7 /100 | #65 | Exceptional 6.9% |
| Immigrants | Belgium | 99.6 /100 | #66 | Exceptional 6.9% |
| Immigrants | Netherlands | 99.5 /100 | #67 | Exceptional 7.0% |
| Paraguayans | 99.4 /100 | #68 | Exceptional 7.0% |
| Immigrants | Eritrea | 99.4 /100 | #69 | Exceptional 7.0% |
| Immigrants | Iraq | 99.4 /100 | #70 | Exceptional 7.0% |
| Afghans | 99.4 /100 | #71 | Exceptional 7.0% |
| Cubans | 99.4 /100 | #72 | Exceptional 7.0% |