Bolivian vs Paiute Unemployment Among Women with Children Under 6 years
COMPARE
Bolivian
Paiute
Unemployment Among Women with Children Under 6 years
Unemployment Among Women with Children Under 6 years Comparison
Bolivians
Paiute
7.5%
UNEMPLOYMENT AMONG WOMEN WITH CHILDREN UNDER 6 YEARS
70.8/ 100
METRIC RATING
160th/ 347
METRIC RANK
9.7%
UNEMPLOYMENT AMONG WOMEN WITH CHILDREN UNDER 6 YEARS
0.0/ 100
METRIC RATING
324th/ 347
METRIC RANK
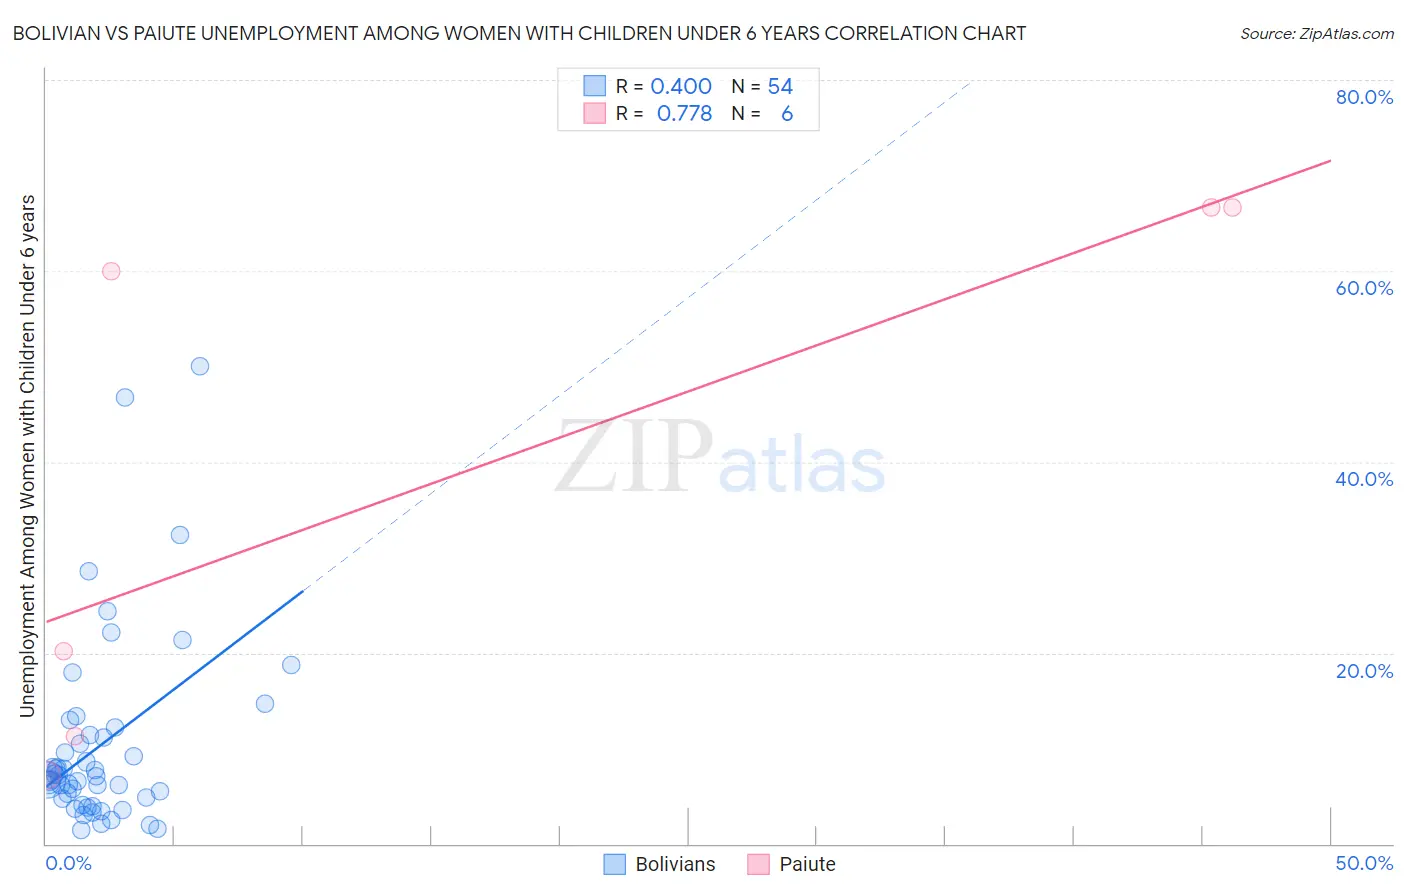
Bolivian vs Paiute Unemployment Among Women with Children Under 6 years Correlation Chart
The statistical analysis conducted on geographies consisting of 159,245,039 people shows a mild positive correlation between the proportion of Bolivians and unemployment rate among women with children under the age of 6 in the United States with a correlation coefficient (R) of 0.400 and weighted average of 7.5%. Similarly, the statistical analysis conducted on geographies consisting of 54,107,424 people shows a strong positive correlation between the proportion of Paiute and unemployment rate among women with children under the age of 6 in the United States with a correlation coefficient (R) of 0.778 and weighted average of 9.7%, a difference of 28.7%.
Unemployment Among Women with Children Under 6 years Correlation Summary
| Measurement | Bolivian | Paiute |
| Minimum | 1.4% | 7.2% |
| Maximum | 50.0% | 66.7% |
| Range | 48.6% | 59.5% |
| Mean | 10.3% | 38.7% |
| Median | 6.9% | 40.1% |
| Interquartile 25% (IQ1) | 4.7% | 11.3% |
| Interquartile 75% (IQ3) | 11.4% | 66.7% |
| Interquartile Range (IQR) | 6.8% | 55.4% |
| Standard Deviation (Sample) | 10.1% | 28.7% |
| Standard Deviation (Population) | 10.0% | 26.2% |
Similar Demographics by Unemployment Among Women with Children Under 6 years
Demographics Similar to Bolivians by Unemployment Among Women with Children Under 6 years
In terms of unemployment among women with children under 6 years, the demographic groups most similar to Bolivians are Immigrants from Philippines (7.5%, a difference of 0.040%), Immigrants from Western Asia (7.5%, a difference of 0.040%), Croatian (7.5%, a difference of 0.090%), Peruvian (7.5%, a difference of 0.12%), and Immigrants from Lithuania (7.5%, a difference of 0.16%).
| Demographics | Rating | Rank | Unemployment Among Women with Children Under 6 years |
| Uruguayans | 74.7 /100 | #153 | Good 7.5% |
| Northern Europeans | 74.3 /100 | #154 | Good 7.5% |
| South Americans | 74.1 /100 | #155 | Good 7.5% |
| Immigrants | Southern Europe | 73.2 /100 | #156 | Good 7.5% |
| Peruvians | 72.3 /100 | #157 | Good 7.5% |
| Croatians | 71.9 /100 | #158 | Good 7.5% |
| Immigrants | Philippines | 71.3 /100 | #159 | Good 7.5% |
| Bolivians | 70.8 /100 | #160 | Good 7.5% |
| Immigrants | Western Asia | 70.2 /100 | #161 | Good 7.5% |
| Immigrants | Lithuania | 68.8 /100 | #162 | Good 7.5% |
| British | 66.3 /100 | #163 | Good 7.6% |
| Ugandans | 65.8 /100 | #164 | Good 7.6% |
| Immigrants | South America | 65.6 /100 | #165 | Good 7.6% |
| Belgians | 63.5 /100 | #166 | Good 7.6% |
| Kenyans | 62.5 /100 | #167 | Good 7.6% |
Demographics Similar to Paiute by Unemployment Among Women with Children Under 6 years
In terms of unemployment among women with children under 6 years, the demographic groups most similar to Paiute are Immigrants from Bahamas (9.6%, a difference of 0.70%), Alaska Native (9.6%, a difference of 0.89%), Choctaw (9.8%, a difference of 0.95%), Delaware (9.8%, a difference of 0.98%), and Central American Indian (9.6%, a difference of 1.1%).
| Demographics | Rating | Rank | Unemployment Among Women with Children Under 6 years |
| Dutch West Indians | 0.0 /100 | #317 | Tragic 9.5% |
| Osage | 0.0 /100 | #318 | Tragic 9.5% |
| Marshallese | 0.0 /100 | #319 | Tragic 9.6% |
| Potawatomi | 0.0 /100 | #320 | Tragic 9.6% |
| Central American Indians | 0.0 /100 | #321 | Tragic 9.6% |
| Alaska Natives | 0.0 /100 | #322 | Tragic 9.6% |
| Immigrants | Bahamas | 0.0 /100 | #323 | Tragic 9.6% |
| Paiute | 0.0 /100 | #324 | Tragic 9.7% |
| Choctaw | 0.0 /100 | #325 | Tragic 9.8% |
| Delaware | 0.0 /100 | #326 | Tragic 9.8% |
| Ottawa | 0.0 /100 | #327 | Tragic 9.9% |
| Tohono O'odham | 0.0 /100 | #328 | Tragic 10.2% |
| Blacks/African Americans | 0.0 /100 | #329 | Tragic 10.3% |
| Pennsylvania Germans | 0.0 /100 | #330 | Tragic 10.8% |
| Colville | 0.0 /100 | #331 | Tragic 11.2% |