Immigrants from Russia vs Paiute Unemployment Among Women with Children Under 6 years
COMPARE
Immigrants from Russia
Paiute
Unemployment Among Women with Children Under 6 years
Unemployment Among Women with Children Under 6 years Comparison
Immigrants from Russia
Paiute
6.7%
UNEMPLOYMENT AMONG WOMEN WITH CHILDREN UNDER 6 YEARS
100.0/ 100
METRIC RATING
39th/ 347
METRIC RANK
9.7%
UNEMPLOYMENT AMONG WOMEN WITH CHILDREN UNDER 6 YEARS
0.0/ 100
METRIC RATING
324th/ 347
METRIC RANK
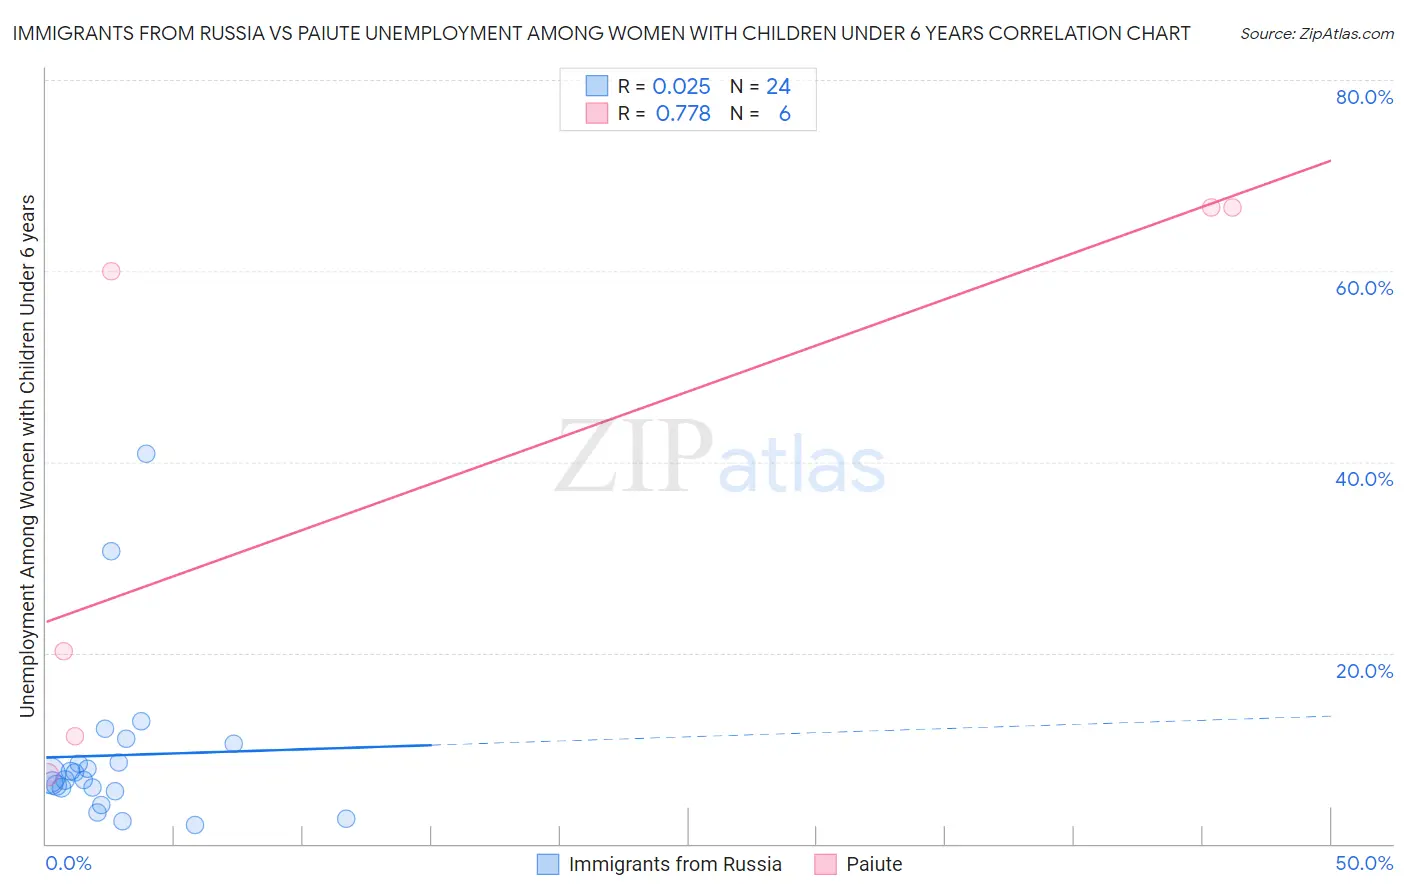
Immigrants from Russia vs Paiute Unemployment Among Women with Children Under 6 years Correlation Chart
The statistical analysis conducted on geographies consisting of 268,851,554 people shows no correlation between the proportion of Immigrants from Russia and unemployment rate among women with children under the age of 6 in the United States with a correlation coefficient (R) of 0.025 and weighted average of 6.7%. Similarly, the statistical analysis conducted on geographies consisting of 54,107,424 people shows a strong positive correlation between the proportion of Paiute and unemployment rate among women with children under the age of 6 in the United States with a correlation coefficient (R) of 0.778 and weighted average of 9.7%, a difference of 45.6%.
Unemployment Among Women with Children Under 6 years Correlation Summary
| Measurement | Immigrants from Russia | Paiute |
| Minimum | 2.0% | 7.2% |
| Maximum | 40.8% | 66.7% |
| Range | 38.8% | 59.5% |
| Mean | 9.3% | 38.7% |
| Median | 7.0% | 40.1% |
| Interquartile 25% (IQ1) | 5.7% | 11.3% |
| Interquartile 75% (IQ3) | 9.5% | 66.7% |
| Interquartile Range (IQR) | 3.9% | 55.4% |
| Standard Deviation (Sample) | 8.8% | 28.7% |
| Standard Deviation (Population) | 8.6% | 26.2% |
Similar Demographics by Unemployment Among Women with Children Under 6 years
Demographics Similar to Immigrants from Russia by Unemployment Among Women with Children Under 6 years
In terms of unemployment among women with children under 6 years, the demographic groups most similar to Immigrants from Russia are Hmong (6.7%, a difference of 0.060%), Sri Lankan (6.6%, a difference of 0.19%), Asian (6.7%, a difference of 0.22%), Immigrants from Indonesia (6.7%, a difference of 0.37%), and Luxembourger (6.6%, a difference of 0.45%).
| Demographics | Rating | Rank | Unemployment Among Women with Children Under 6 years |
| Tsimshian | 100.0 /100 | #32 | Exceptional 6.6% |
| Immigrants | Vietnam | 100.0 /100 | #33 | Exceptional 6.6% |
| Immigrants | South Central Asia | 100.0 /100 | #34 | Exceptional 6.6% |
| Yakama | 100.0 /100 | #35 | Exceptional 6.6% |
| Luxembourgers | 100.0 /100 | #36 | Exceptional 6.6% |
| Sri Lankans | 100.0 /100 | #37 | Exceptional 6.6% |
| Hmong | 100.0 /100 | #38 | Exceptional 6.7% |
| Immigrants | Russia | 100.0 /100 | #39 | Exceptional 6.7% |
| Asians | 100.0 /100 | #40 | Exceptional 6.7% |
| Immigrants | Indonesia | 99.9 /100 | #41 | Exceptional 6.7% |
| Immigrants | Cuba | 99.9 /100 | #42 | Exceptional 6.7% |
| Bhutanese | 99.9 /100 | #43 | Exceptional 6.7% |
| Iranians | 99.9 /100 | #44 | Exceptional 6.7% |
| Immigrants | Australia | 99.9 /100 | #45 | Exceptional 6.8% |
| Latvians | 99.9 /100 | #46 | Exceptional 6.8% |
Demographics Similar to Paiute by Unemployment Among Women with Children Under 6 years
In terms of unemployment among women with children under 6 years, the demographic groups most similar to Paiute are Immigrants from Bahamas (9.6%, a difference of 0.70%), Alaska Native (9.6%, a difference of 0.89%), Choctaw (9.8%, a difference of 0.95%), Delaware (9.8%, a difference of 0.98%), and Central American Indian (9.6%, a difference of 1.1%).
| Demographics | Rating | Rank | Unemployment Among Women with Children Under 6 years |
| Dutch West Indians | 0.0 /100 | #317 | Tragic 9.5% |
| Osage | 0.0 /100 | #318 | Tragic 9.5% |
| Marshallese | 0.0 /100 | #319 | Tragic 9.6% |
| Potawatomi | 0.0 /100 | #320 | Tragic 9.6% |
| Central American Indians | 0.0 /100 | #321 | Tragic 9.6% |
| Alaska Natives | 0.0 /100 | #322 | Tragic 9.6% |
| Immigrants | Bahamas | 0.0 /100 | #323 | Tragic 9.6% |
| Paiute | 0.0 /100 | #324 | Tragic 9.7% |
| Choctaw | 0.0 /100 | #325 | Tragic 9.8% |
| Delaware | 0.0 /100 | #326 | Tragic 9.8% |
| Ottawa | 0.0 /100 | #327 | Tragic 9.9% |
| Tohono O'odham | 0.0 /100 | #328 | Tragic 10.2% |
| Blacks/African Americans | 0.0 /100 | #329 | Tragic 10.3% |
| Pennsylvania Germans | 0.0 /100 | #330 | Tragic 10.8% |
| Colville | 0.0 /100 | #331 | Tragic 11.2% |