Colombian vs Immigrants from Israel 3rd Grade
COMPARE
Colombian
Immigrants from Israel
3rd Grade
3rd Grade Comparison
Colombians
Immigrants from Israel
97.4%
3RD GRADE
1.8/ 100
METRIC RATING
237th/ 347
METRIC RANK
97.9%
3RD GRADE
77.3/ 100
METRIC RATING
147th/ 347
METRIC RANK
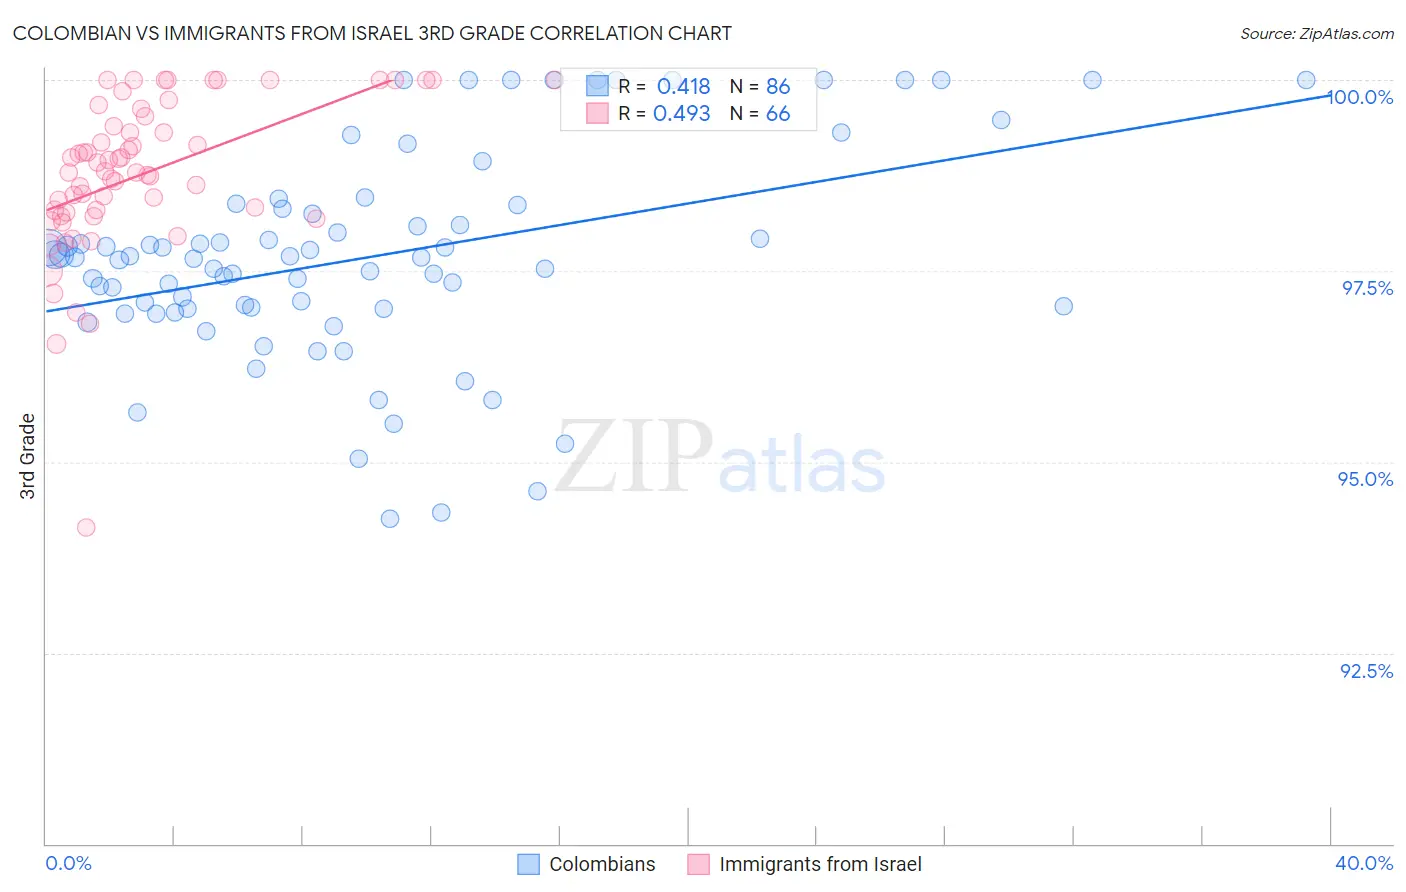
Colombian vs Immigrants from Israel 3rd Grade Correlation Chart
The statistical analysis conducted on geographies consisting of 419,700,680 people shows a moderate positive correlation between the proportion of Colombians and percentage of population with at least 3rd grade education in the United States with a correlation coefficient (R) of 0.418 and weighted average of 97.4%. Similarly, the statistical analysis conducted on geographies consisting of 210,029,773 people shows a moderate positive correlation between the proportion of Immigrants from Israel and percentage of population with at least 3rd grade education in the United States with a correlation coefficient (R) of 0.493 and weighted average of 97.9%, a difference of 0.45%.
3rd Grade Correlation Summary
| Measurement | Colombian | Immigrants from Israel |
| Minimum | 94.3% | 94.1% |
| Maximum | 100.0% | 100.0% |
| Range | 5.7% | 5.9% |
| Mean | 97.7% | 98.8% |
| Median | 97.7% | 98.8% |
| Interquartile 25% (IQ1) | 97.0% | 98.3% |
| Interquartile 75% (IQ3) | 98.3% | 99.5% |
| Interquartile Range (IQR) | 1.3% | 1.3% |
| Standard Deviation (Sample) | 1.4% | 1.0% |
| Standard Deviation (Population) | 1.4% | 1.0% |
Similar Demographics by 3rd Grade
Demographics Similar to Colombians by 3rd Grade
In terms of 3rd grade, the demographic groups most similar to Colombians are Immigrants from Iraq (97.4%, a difference of 0.0%), Liberian (97.4%, a difference of 0.0%), Immigrants from Uruguay (97.4%, a difference of 0.0%), Immigrants from Eastern Asia (97.4%, a difference of 0.010%), and Nigerian (97.4%, a difference of 0.010%).
| Demographics | Rating | Rank | 3rd Grade |
| Immigrants | Pakistan | 2.7 /100 | #230 | Tragic 97.5% |
| Immigrants | Costa Rica | 2.7 /100 | #231 | Tragic 97.5% |
| Immigrants | Western Asia | 2.6 /100 | #232 | Tragic 97.5% |
| Immigrants | Malaysia | 2.4 /100 | #233 | Tragic 97.5% |
| Immigrants | Eastern Asia | 1.9 /100 | #234 | Tragic 97.4% |
| Immigrants | Iraq | 1.8 /100 | #235 | Tragic 97.4% |
| Liberians | 1.8 /100 | #236 | Tragic 97.4% |
| Colombians | 1.8 /100 | #237 | Tragic 97.4% |
| Immigrants | Uruguay | 1.7 /100 | #238 | Tragic 97.4% |
| Nigerians | 1.6 /100 | #239 | Tragic 97.4% |
| U.S. Virgin Islanders | 1.4 /100 | #240 | Tragic 97.4% |
| Immigrants | Indonesia | 1.4 /100 | #241 | Tragic 97.4% |
| Koreans | 1.3 /100 | #242 | Tragic 97.4% |
| Indians (Asian) | 1.3 /100 | #243 | Tragic 97.4% |
| Asians | 1.1 /100 | #244 | Tragic 97.4% |
Demographics Similar to Immigrants from Israel by 3rd Grade
In terms of 3rd grade, the demographic groups most similar to Immigrants from Israel are Alsatian (97.9%, a difference of 0.0%), Immigrants from Moldova (97.9%, a difference of 0.0%), Filipino (97.9%, a difference of 0.010%), Burmese (97.9%, a difference of 0.010%), and Immigrants from Greece (97.9%, a difference of 0.010%).
| Demographics | Rating | Rank | 3rd Grade |
| Palestinians | 84.6 /100 | #140 | Excellent 97.9% |
| Immigrants | Turkey | 83.5 /100 | #141 | Excellent 97.9% |
| Hmong | 80.3 /100 | #142 | Excellent 97.9% |
| Filipinos | 79.9 /100 | #143 | Good 97.9% |
| Burmese | 79.6 /100 | #144 | Good 97.9% |
| Immigrants | Greece | 79.5 /100 | #145 | Good 97.9% |
| Alsatians | 78.3 /100 | #146 | Good 97.9% |
| Immigrants | Israel | 77.3 /100 | #147 | Good 97.9% |
| Immigrants | Moldova | 77.1 /100 | #148 | Good 97.9% |
| Immigrants | North Macedonia | 74.5 /100 | #149 | Good 97.8% |
| Jordanians | 74.5 /100 | #150 | Good 97.8% |
| Soviet Union | 72.6 /100 | #151 | Good 97.8% |
| Immigrants | South Central Asia | 69.5 /100 | #152 | Good 97.8% |
| Apache | 68.5 /100 | #153 | Good 97.8% |
| Immigrants | Eastern Europe | 64.1 /100 | #154 | Good 97.8% |