Brazilian vs Vietnamese Unemployment Among Women with Children Ages 6 to 17 years
COMPARE
Brazilian
Vietnamese
Unemployment Among Women with Children Ages 6 to 17 years
Unemployment Among Women with Children Ages 6 to 17 years Comparison
Brazilians
Vietnamese
9.1%
UNEMPLOYMENT AMONG WOMEN WITH CHILDREN AGES 6 TO 17 YEARS
24.4/ 100
METRIC RATING
196th/ 347
METRIC RANK
8.9%
UNEMPLOYMENT AMONG WOMEN WITH CHILDREN AGES 6 TO 17 YEARS
72.1/ 100
METRIC RATING
154th/ 347
METRIC RANK
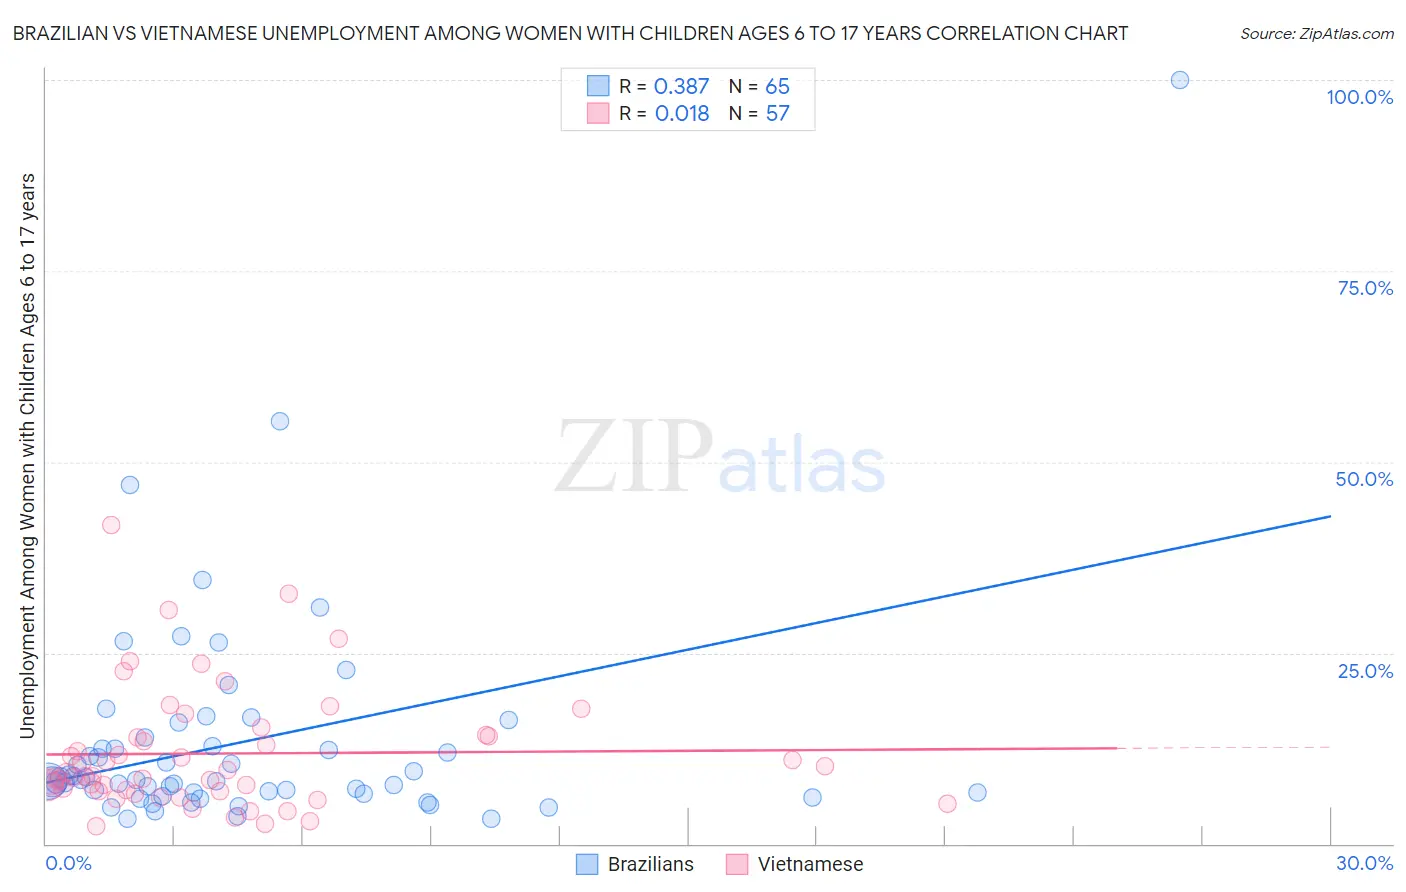
Brazilian vs Vietnamese Unemployment Among Women with Children Ages 6 to 17 years Correlation Chart
The statistical analysis conducted on geographies consisting of 240,779,171 people shows a mild positive correlation between the proportion of Brazilians and unemployment rate among women with children between the ages 6 and 17 in the United States with a correlation coefficient (R) of 0.387 and weighted average of 9.1%. Similarly, the statistical analysis conducted on geographies consisting of 144,141,826 people shows no correlation between the proportion of Vietnamese and unemployment rate among women with children between the ages 6 and 17 in the United States with a correlation coefficient (R) of 0.018 and weighted average of 8.9%, a difference of 2.3%.
Unemployment Among Women with Children Ages 6 to 17 years Correlation Summary
| Measurement | Brazilian | Vietnamese |
| Minimum | 3.3% | 2.4% |
| Maximum | 100.0% | 41.7% |
| Range | 96.7% | 39.3% |
| Mean | 13.3% | 11.8% |
| Median | 8.4% | 8.8% |
| Interquartile 25% (IQ1) | 6.7% | 6.9% |
| Interquartile 75% (IQ3) | 13.3% | 14.2% |
| Interquartile Range (IQR) | 6.7% | 7.3% |
| Standard Deviation (Sample) | 14.7% | 7.9% |
| Standard Deviation (Population) | 14.5% | 7.9% |
Similar Demographics by Unemployment Among Women with Children Ages 6 to 17 years
Demographics Similar to Brazilians by Unemployment Among Women with Children Ages 6 to 17 years
In terms of unemployment among women with children ages 6 to 17 years, the demographic groups most similar to Brazilians are Immigrants from Panama (9.1%, a difference of 0.010%), Austrian (9.1%, a difference of 0.030%), Immigrants from Kazakhstan (9.1%, a difference of 0.050%), Immigrants from Turkey (9.1%, a difference of 0.080%), and Guamanian/Chamorro (9.1%, a difference of 0.16%).
| Demographics | Rating | Rank | Unemployment Among Women with Children Ages 6 to 17 years |
| Immigrants | Immigrants | 29.2 /100 | #189 | Fair 9.1% |
| Slovenes | 28.5 /100 | #190 | Fair 9.1% |
| Belizeans | 28.4 /100 | #191 | Fair 9.1% |
| Guamanians/Chamorros | 27.2 /100 | #192 | Fair 9.1% |
| Immigrants | Turkey | 25.8 /100 | #193 | Fair 9.1% |
| Immigrants | Kazakhstan | 25.3 /100 | #194 | Fair 9.1% |
| Austrians | 25.0 /100 | #195 | Fair 9.1% |
| Brazilians | 24.4 /100 | #196 | Fair 9.1% |
| Immigrants | Panama | 24.3 /100 | #197 | Fair 9.1% |
| Guyanese | 21.8 /100 | #198 | Fair 9.1% |
| Czechoslovakians | 20.8 /100 | #199 | Fair 9.1% |
| Trinidadians and Tobagonians | 18.2 /100 | #200 | Poor 9.1% |
| Immigrants | Trinidad and Tobago | 16.7 /100 | #201 | Poor 9.1% |
| Immigrants | Middle Africa | 15.6 /100 | #202 | Poor 9.1% |
| Maltese | 15.3 /100 | #203 | Poor 9.1% |
Demographics Similar to Vietnamese by Unemployment Among Women with Children Ages 6 to 17 years
In terms of unemployment among women with children ages 6 to 17 years, the demographic groups most similar to Vietnamese are Immigrants from Greece (8.9%, a difference of 0.020%), Immigrants from Europe (8.9%, a difference of 0.070%), Immigrants from Eastern Africa (8.9%, a difference of 0.14%), Immigrants from Northern Europe (8.9%, a difference of 0.14%), and Greek (8.9%, a difference of 0.18%).
| Demographics | Rating | Rank | Unemployment Among Women with Children Ages 6 to 17 years |
| Immigrants | Bangladesh | 79.4 /100 | #147 | Good 8.8% |
| Costa Ricans | 77.0 /100 | #148 | Good 8.8% |
| Croatians | 76.0 /100 | #149 | Good 8.8% |
| Greeks | 75.2 /100 | #150 | Good 8.9% |
| Immigrants | Eastern Africa | 74.6 /100 | #151 | Good 8.9% |
| Immigrants | Northern Europe | 74.6 /100 | #152 | Good 8.9% |
| Immigrants | Europe | 73.4 /100 | #153 | Good 8.9% |
| Vietnamese | 72.1 /100 | #154 | Good 8.9% |
| Immigrants | Greece | 71.8 /100 | #155 | Good 8.9% |
| Osage | 65.9 /100 | #156 | Good 8.9% |
| Immigrants | Belgium | 65.6 /100 | #157 | Good 8.9% |
| Immigrants | Chile | 65.3 /100 | #158 | Good 8.9% |
| Spanish | 63.8 /100 | #159 | Good 8.9% |
| Immigrants | Hungary | 63.4 /100 | #160 | Good 8.9% |
| Immigrants | Guyana | 63.0 /100 | #161 | Good 8.9% |