Immigrants from Latin America vs Kenyan Female Unemployment
COMPARE
Immigrants from Latin America
Kenyan
Female Unemployment
Female Unemployment Comparison
Immigrants from Latin America
Kenyans
6.1%
FEMALE UNEMPLOYMENT
0.0/ 100
METRIC RATING
295th/ 347
METRIC RANK
5.0%
FEMALE UNEMPLOYMENT
93.7/ 100
METRIC RATING
104th/ 347
METRIC RANK
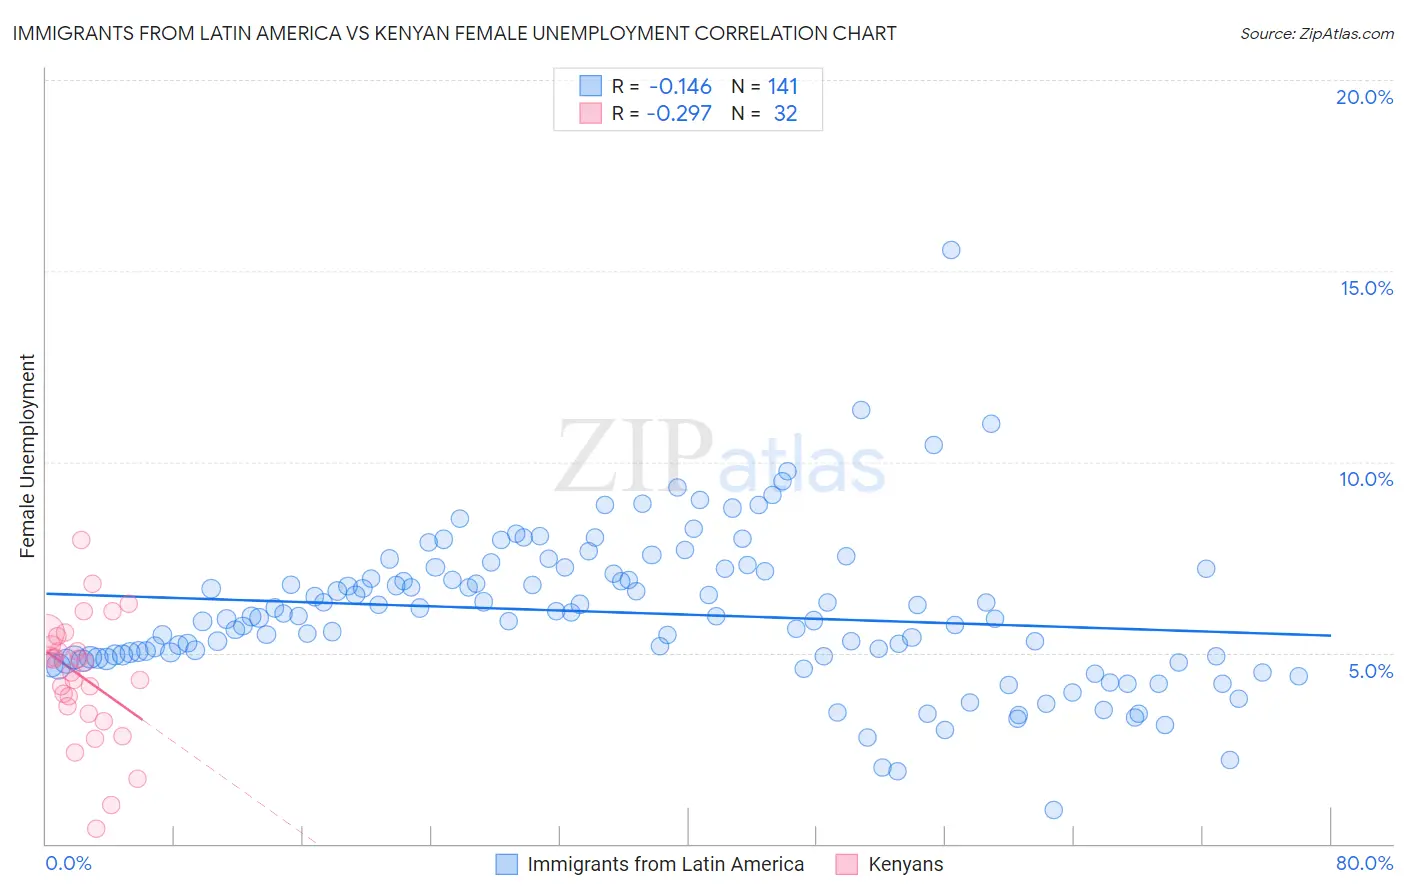
Immigrants from Latin America vs Kenyan Female Unemployment Correlation Chart
The statistical analysis conducted on geographies consisting of 548,551,926 people shows a poor negative correlation between the proportion of Immigrants from Latin America and unemploymnet rate among females in the United States with a correlation coefficient (R) of -0.146 and weighted average of 6.1%. Similarly, the statistical analysis conducted on geographies consisting of 168,081,241 people shows a weak negative correlation between the proportion of Kenyans and unemploymnet rate among females in the United States with a correlation coefficient (R) of -0.297 and weighted average of 5.0%, a difference of 21.3%.
Female Unemployment Correlation Summary
| Measurement | Immigrants from Latin America | Kenyan |
| Minimum | 0.90% | 0.40% |
| Maximum | 15.5% | 7.9% |
| Range | 14.6% | 7.5% |
| Mean | 6.1% | 4.4% |
| Median | 6.0% | 4.6% |
| Interquartile 25% (IQ1) | 4.9% | 3.5% |
| Interquartile 75% (IQ3) | 7.2% | 5.3% |
| Interquartile Range (IQR) | 2.3% | 1.8% |
| Standard Deviation (Sample) | 2.0% | 1.6% |
| Standard Deviation (Population) | 2.0% | 1.6% |
Similar Demographics by Female Unemployment
Demographics Similar to Immigrants from Latin America by Female Unemployment
In terms of female unemployment, the demographic groups most similar to Immigrants from Latin America are Alaskan Athabascan (6.1%, a difference of 0.020%), West Indian (6.1%, a difference of 0.030%), Jamaican (6.1%, a difference of 0.050%), Immigrants from El Salvador (6.1%, a difference of 0.10%), and Ute (6.1%, a difference of 0.16%).
| Demographics | Rating | Rank | Female Unemployment |
| Haitians | 0.0 /100 | #288 | Tragic 6.1% |
| Trinidadians and Tobagonians | 0.0 /100 | #289 | Tragic 6.1% |
| Immigrants | Caribbean | 0.0 /100 | #290 | Tragic 6.1% |
| Immigrants | West Indies | 0.0 /100 | #291 | Tragic 6.1% |
| Immigrants | Trinidad and Tobago | 0.0 /100 | #292 | Tragic 6.1% |
| Mexicans | 0.0 /100 | #293 | Tragic 6.1% |
| Immigrants | El Salvador | 0.0 /100 | #294 | Tragic 6.1% |
| Immigrants | Latin America | 0.0 /100 | #295 | Tragic 6.1% |
| Alaskan Athabascans | 0.0 /100 | #296 | Tragic 6.1% |
| West Indians | 0.0 /100 | #297 | Tragic 6.1% |
| Jamaicans | 0.0 /100 | #298 | Tragic 6.1% |
| Ute | 0.0 /100 | #299 | Tragic 6.1% |
| Immigrants | Haiti | 0.0 /100 | #300 | Tragic 6.1% |
| Immigrants | Barbados | 0.0 /100 | #301 | Tragic 6.2% |
| U.S. Virgin Islanders | 0.0 /100 | #302 | Tragic 6.2% |
Demographics Similar to Kenyans by Female Unemployment
In terms of female unemployment, the demographic groups most similar to Kenyans are Immigrants from England (5.0%, a difference of 0.020%), Paraguayan (5.1%, a difference of 0.12%), Immigrants from Switzerland (5.1%, a difference of 0.15%), Puget Sound Salish (5.1%, a difference of 0.17%), and Immigrants from Eastern Africa (5.1%, a difference of 0.21%).
| Demographics | Rating | Rank | Female Unemployment |
| Immigrants | Somalia | 95.2 /100 | #97 | Exceptional 5.0% |
| Immigrants | Kuwait | 95.2 /100 | #98 | Exceptional 5.0% |
| Immigrants | Zaire | 95.2 /100 | #99 | Exceptional 5.0% |
| Indonesians | 95.1 /100 | #100 | Exceptional 5.0% |
| Immigrants | Czechoslovakia | 95.0 /100 | #101 | Exceptional 5.0% |
| Immigrants | Kenya | 94.8 /100 | #102 | Exceptional 5.0% |
| Somalis | 94.6 /100 | #103 | Exceptional 5.0% |
| Kenyans | 93.7 /100 | #104 | Exceptional 5.0% |
| Immigrants | England | 93.6 /100 | #105 | Exceptional 5.0% |
| Paraguayans | 93.2 /100 | #106 | Exceptional 5.1% |
| Immigrants | Switzerland | 93.1 /100 | #107 | Exceptional 5.1% |
| Puget Sound Salish | 93.0 /100 | #108 | Exceptional 5.1% |
| Immigrants | Eastern Africa | 92.8 /100 | #109 | Exceptional 5.1% |
| Macedonians | 92.4 /100 | #110 | Exceptional 5.1% |
| Immigrants | Burma/Myanmar | 92.3 /100 | #111 | Exceptional 5.1% |