Immigrants from Indonesia vs Kenyan Female Unemployment
COMPARE
Immigrants from Indonesia
Kenyan
Female Unemployment
Female Unemployment Comparison
Immigrants from Indonesia
Kenyans
5.3%
FEMALE UNEMPLOYMENT
40.7/ 100
METRIC RATING
183rd/ 347
METRIC RANK
5.0%
FEMALE UNEMPLOYMENT
93.7/ 100
METRIC RATING
104th/ 347
METRIC RANK
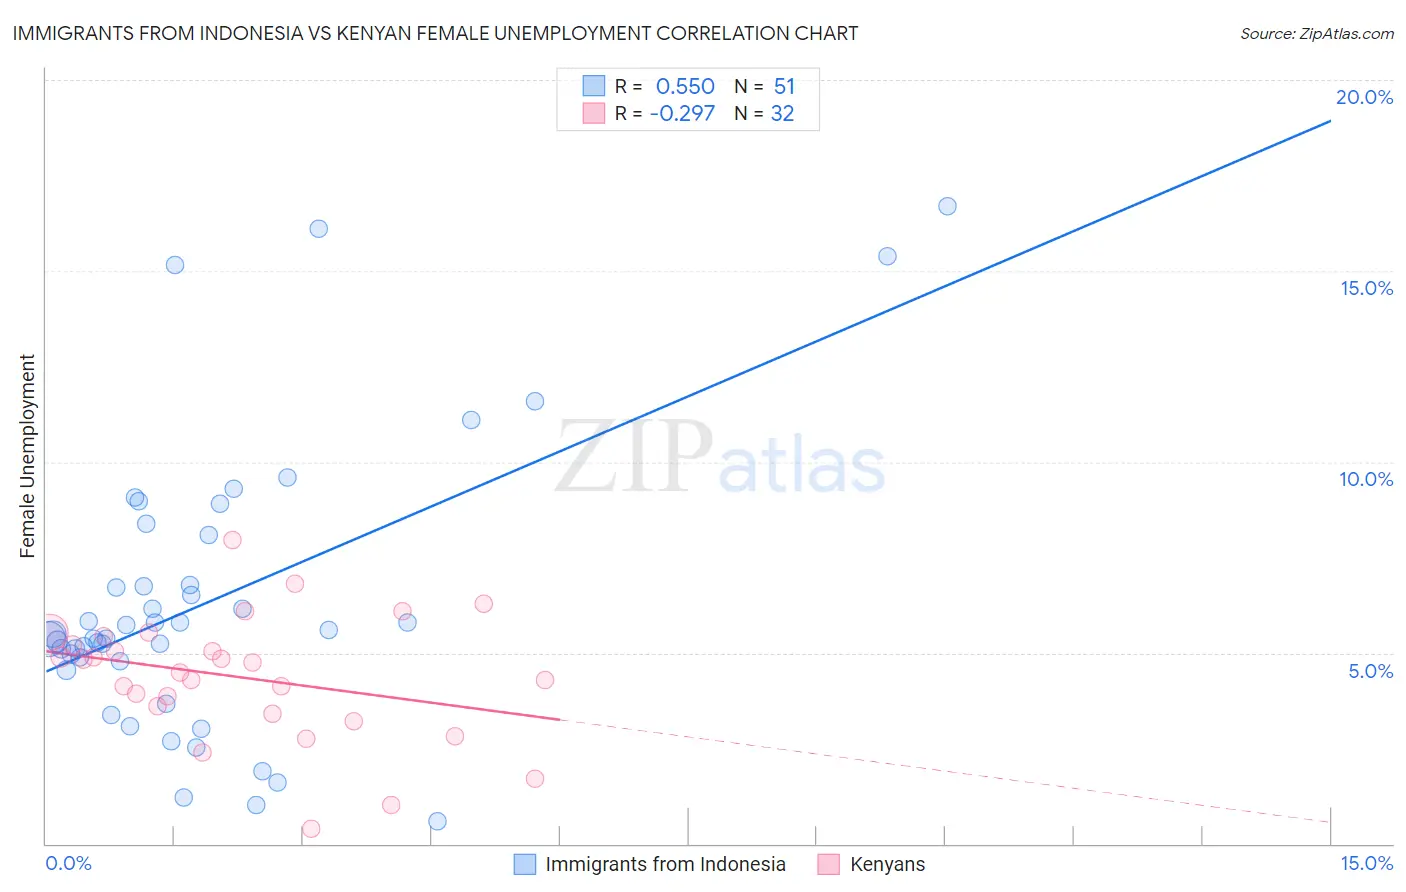
Immigrants from Indonesia vs Kenyan Female Unemployment Correlation Chart
The statistical analysis conducted on geographies consisting of 215,529,096 people shows a substantial positive correlation between the proportion of Immigrants from Indonesia and unemploymnet rate among females in the United States with a correlation coefficient (R) of 0.550 and weighted average of 5.3%. Similarly, the statistical analysis conducted on geographies consisting of 168,081,241 people shows a weak negative correlation between the proportion of Kenyans and unemploymnet rate among females in the United States with a correlation coefficient (R) of -0.297 and weighted average of 5.0%, a difference of 4.8%.
Female Unemployment Correlation Summary
| Measurement | Immigrants from Indonesia | Kenyan |
| Minimum | 0.60% | 0.40% |
| Maximum | 16.7% | 7.9% |
| Range | 16.1% | 7.5% |
| Mean | 6.3% | 4.4% |
| Median | 5.5% | 4.6% |
| Interquartile 25% (IQ1) | 4.8% | 3.5% |
| Interquartile 75% (IQ3) | 8.1% | 5.3% |
| Interquartile Range (IQR) | 3.3% | 1.8% |
| Standard Deviation (Sample) | 3.7% | 1.6% |
| Standard Deviation (Population) | 3.7% | 1.6% |
Similar Demographics by Female Unemployment
Demographics Similar to Immigrants from Indonesia by Female Unemployment
In terms of female unemployment, the demographic groups most similar to Immigrants from Indonesia are Immigrants from Ukraine (5.3%, a difference of 0.030%), Malaysian (5.3%, a difference of 0.040%), Immigrants from Belarus (5.3%, a difference of 0.080%), Taiwanese (5.3%, a difference of 0.12%), and Nonimmigrants (5.3%, a difference of 0.12%).
| Demographics | Rating | Rank | Female Unemployment |
| Immigrants | Vietnam | 47.5 /100 | #176 | Average 5.3% |
| Immigrants | Morocco | 47.4 /100 | #177 | Average 5.3% |
| Immigrants | Southern Europe | 46.2 /100 | #178 | Average 5.3% |
| Laotians | 45.1 /100 | #179 | Average 5.3% |
| Immigrants | Congo | 43.1 /100 | #180 | Average 5.3% |
| Taiwanese | 42.7 /100 | #181 | Average 5.3% |
| Immigrants | Nonimmigrants | 42.6 /100 | #182 | Average 5.3% |
| Immigrants | Indonesia | 40.7 /100 | #183 | Average 5.3% |
| Immigrants | Ukraine | 40.1 /100 | #184 | Average 5.3% |
| Malaysians | 40.1 /100 | #185 | Average 5.3% |
| Immigrants | Belarus | 39.4 /100 | #186 | Fair 5.3% |
| Immigrants | Albania | 35.4 /100 | #187 | Fair 5.3% |
| Afghans | 33.9 /100 | #188 | Fair 5.3% |
| Costa Ricans | 33.8 /100 | #189 | Fair 5.3% |
| Ugandans | 31.2 /100 | #190 | Fair 5.3% |
Demographics Similar to Kenyans by Female Unemployment
In terms of female unemployment, the demographic groups most similar to Kenyans are Immigrants from England (5.0%, a difference of 0.020%), Paraguayan (5.1%, a difference of 0.12%), Immigrants from Switzerland (5.1%, a difference of 0.15%), Puget Sound Salish (5.1%, a difference of 0.17%), and Immigrants from Eastern Africa (5.1%, a difference of 0.21%).
| Demographics | Rating | Rank | Female Unemployment |
| Immigrants | Somalia | 95.2 /100 | #97 | Exceptional 5.0% |
| Immigrants | Kuwait | 95.2 /100 | #98 | Exceptional 5.0% |
| Immigrants | Zaire | 95.2 /100 | #99 | Exceptional 5.0% |
| Indonesians | 95.1 /100 | #100 | Exceptional 5.0% |
| Immigrants | Czechoslovakia | 95.0 /100 | #101 | Exceptional 5.0% |
| Immigrants | Kenya | 94.8 /100 | #102 | Exceptional 5.0% |
| Somalis | 94.6 /100 | #103 | Exceptional 5.0% |
| Kenyans | 93.7 /100 | #104 | Exceptional 5.0% |
| Immigrants | England | 93.6 /100 | #105 | Exceptional 5.0% |
| Paraguayans | 93.2 /100 | #106 | Exceptional 5.1% |
| Immigrants | Switzerland | 93.1 /100 | #107 | Exceptional 5.1% |
| Puget Sound Salish | 93.0 /100 | #108 | Exceptional 5.1% |
| Immigrants | Eastern Africa | 92.8 /100 | #109 | Exceptional 5.1% |
| Macedonians | 92.4 /100 | #110 | Exceptional 5.1% |
| Immigrants | Burma/Myanmar | 92.3 /100 | #111 | Exceptional 5.1% |