Immigrants from Belgium vs Eastern European Female Unemployment
COMPARE
Immigrants from Belgium
Eastern European
Female Unemployment
Female Unemployment Comparison
Immigrants from Belgium
Eastern Europeans
4.9%
FEMALE UNEMPLOYMENT
98.5/ 100
METRIC RATING
63rd/ 347
METRIC RANK
4.9%
FEMALE UNEMPLOYMENT
99.4/ 100
METRIC RATING
43rd/ 347
METRIC RANK
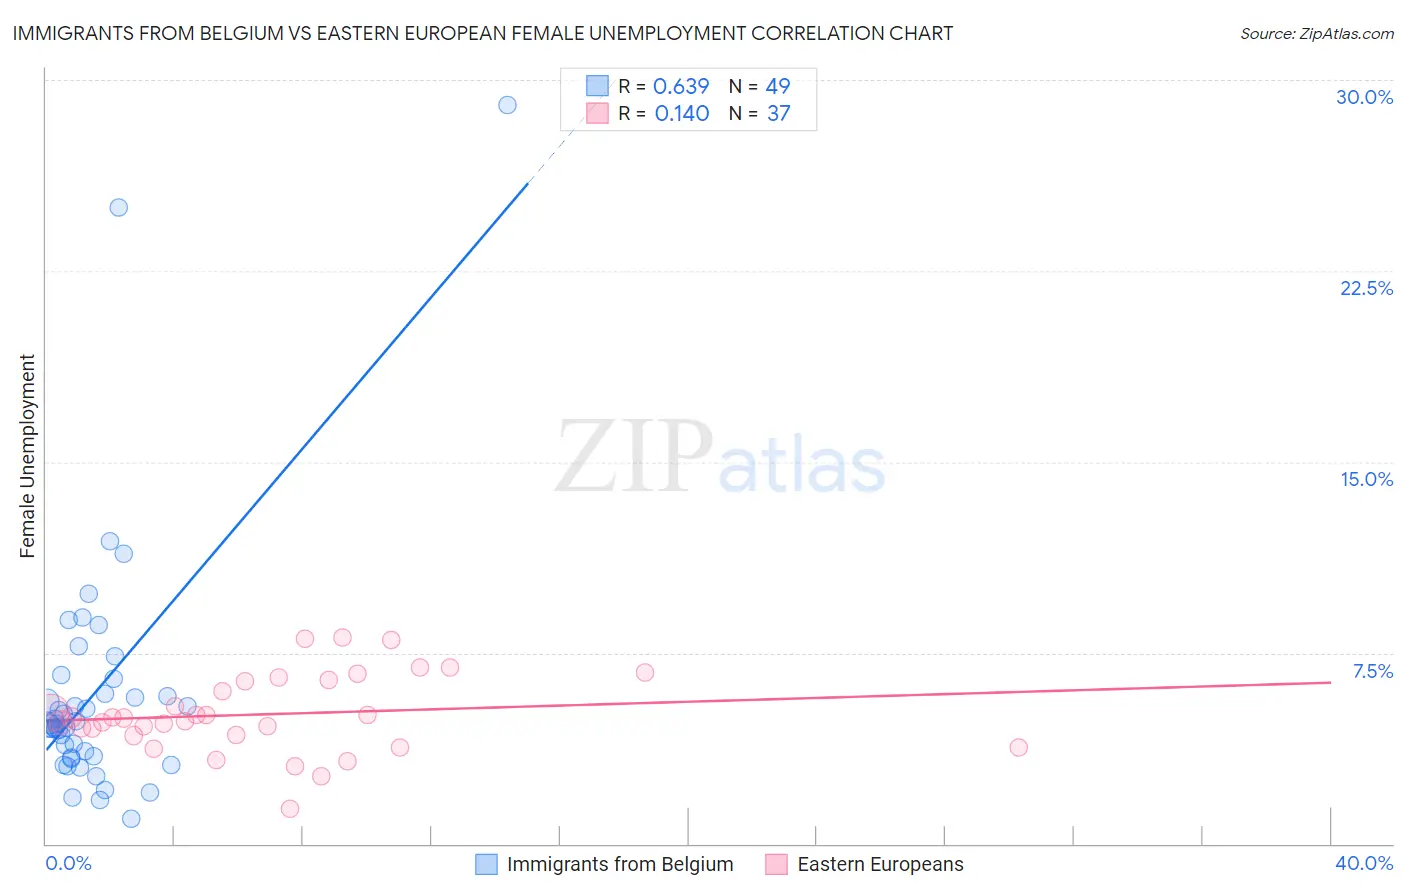
Immigrants from Belgium vs Eastern European Female Unemployment Correlation Chart
The statistical analysis conducted on geographies consisting of 146,408,368 people shows a significant positive correlation between the proportion of Immigrants from Belgium and unemploymnet rate among females in the United States with a correlation coefficient (R) of 0.639 and weighted average of 4.9%. Similarly, the statistical analysis conducted on geographies consisting of 456,874,876 people shows a poor positive correlation between the proportion of Eastern Europeans and unemploymnet rate among females in the United States with a correlation coefficient (R) of 0.140 and weighted average of 4.9%, a difference of 1.5%.
Female Unemployment Correlation Summary
| Measurement | Immigrants from Belgium | Eastern European |
| Minimum | 1.0% | 1.4% |
| Maximum | 29.0% | 8.1% |
| Range | 28.0% | 6.7% |
| Mean | 5.9% | 5.1% |
| Median | 4.7% | 4.9% |
| Interquartile 25% (IQ1) | 3.4% | 4.3% |
| Interquartile 75% (IQ3) | 6.2% | 6.4% |
| Interquartile Range (IQR) | 2.8% | 2.1% |
| Standard Deviation (Sample) | 5.0% | 1.5% |
| Standard Deviation (Population) | 4.9% | 1.5% |
Demographics Similar to Immigrants from Belgium and Eastern Europeans by Female Unemployment
In terms of female unemployment, the demographic groups most similar to Immigrants from Belgium are Immigrants from Nepal (4.9%, a difference of 0.11%), Immigrants from Scotland (4.9%, a difference of 0.12%), Immigrants from Canada (4.9%, a difference of 0.12%), Bhutanese (4.9%, a difference of 0.20%), and Immigrants from Lithuania (4.9%, a difference of 0.32%). Similarly, the demographic groups most similar to Eastern Europeans are Greek (4.9%, a difference of 0.11%), Austrian (4.9%, a difference of 0.18%), Immigrants from Bulgaria (4.9%, a difference of 0.21%), Okinawan (4.9%, a difference of 0.29%), and Thai (4.9%, a difference of 0.50%).
| Demographics | Rating | Rank | Female Unemployment |
| Eastern Europeans | 99.4 /100 | #43 | Exceptional 4.9% |
| Greeks | 99.4 /100 | #44 | Exceptional 4.9% |
| Austrians | 99.3 /100 | #45 | Exceptional 4.9% |
| Immigrants | Bulgaria | 99.3 /100 | #46 | Exceptional 4.9% |
| Okinawans | 99.3 /100 | #47 | Exceptional 4.9% |
| Thais | 99.2 /100 | #48 | Exceptional 4.9% |
| Australians | 99.2 /100 | #49 | Exceptional 4.9% |
| Immigrants | Cuba | 99.1 /100 | #50 | Exceptional 4.9% |
| Cambodians | 99.1 /100 | #51 | Exceptional 4.9% |
| Slavs | 99.1 /100 | #52 | Exceptional 4.9% |
| Whites/Caucasians | 99.0 /100 | #53 | Exceptional 4.9% |
| Immigrants | Zimbabwe | 99.0 /100 | #54 | Exceptional 4.9% |
| Immigrants | Moldova | 99.0 /100 | #55 | Exceptional 4.9% |
| Serbians | 99.0 /100 | #56 | Exceptional 4.9% |
| Icelanders | 98.8 /100 | #57 | Exceptional 4.9% |
| Immigrants | Lithuania | 98.8 /100 | #58 | Exceptional 4.9% |
| Bhutanese | 98.7 /100 | #59 | Exceptional 4.9% |
| Immigrants | Scotland | 98.6 /100 | #60 | Exceptional 4.9% |
| Immigrants | Canada | 98.6 /100 | #61 | Exceptional 4.9% |
| Immigrants | Nepal | 98.6 /100 | #62 | Exceptional 4.9% |
| Immigrants | Belgium | 98.5 /100 | #63 | Exceptional 4.9% |