Scotch-Irish vs African Male Unemployment
COMPARE
Scotch-Irish
African
Male Unemployment
Male Unemployment Comparison
Scotch-Irish
Africans
4.9%
MALE UNEMPLOYMENT
99.4/ 100
METRIC RATING
37th/ 347
METRIC RANK
6.3%
MALE UNEMPLOYMENT
0.0/ 100
METRIC RATING
286th/ 347
METRIC RANK
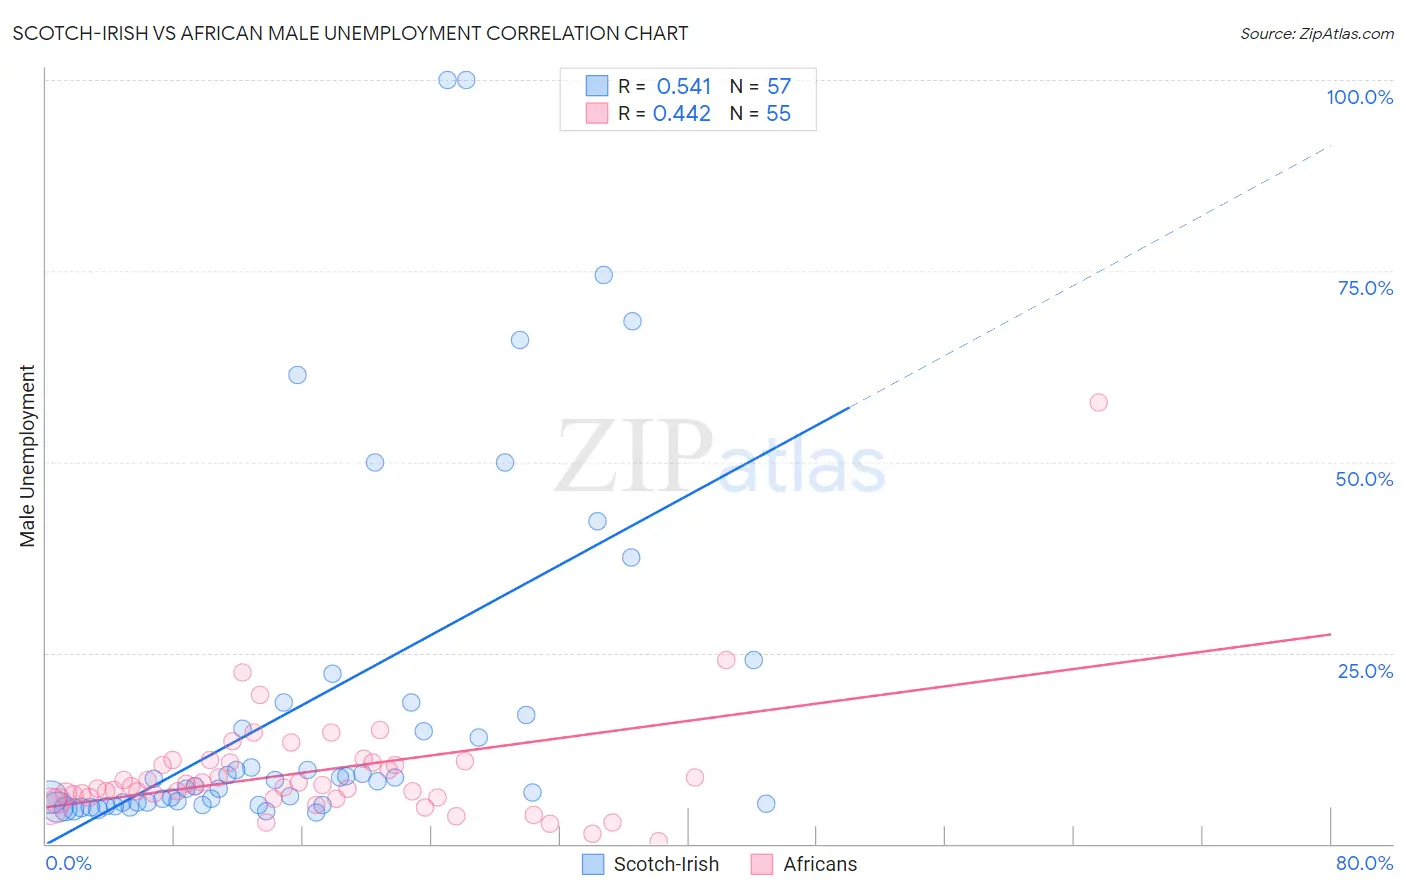
Scotch-Irish vs African Male Unemployment Correlation Chart
The statistical analysis conducted on geographies consisting of 539,618,671 people shows a substantial positive correlation between the proportion of Scotch-Irish and unemployment rate among males in the United States with a correlation coefficient (R) of 0.541 and weighted average of 4.9%. Similarly, the statistical analysis conducted on geographies consisting of 467,193,011 people shows a moderate positive correlation between the proportion of Africans and unemployment rate among males in the United States with a correlation coefficient (R) of 0.442 and weighted average of 6.3%, a difference of 27.5%.
Male Unemployment Correlation Summary
| Measurement | Scotch-Irish | African |
| Minimum | 4.1% | 0.40% |
| Maximum | 100.0% | 57.8% |
| Range | 95.9% | 57.4% |
| Mean | 18.3% | 9.3% |
| Median | 8.2% | 7.5% |
| Interquartile 25% (IQ1) | 5.2% | 6.1% |
| Interquartile 75% (IQ3) | 17.7% | 10.6% |
| Interquartile Range (IQR) | 12.5% | 4.5% |
| Standard Deviation (Sample) | 23.8% | 8.1% |
| Standard Deviation (Population) | 23.6% | 8.0% |
Similar Demographics by Male Unemployment
Demographics Similar to Scotch-Irish by Male Unemployment
In terms of male unemployment, the demographic groups most similar to Scotch-Irish are Immigrants from Bosnia and Herzegovina (4.9%, a difference of 0.020%), Burmese (4.9%, a difference of 0.090%), Northern European (4.9%, a difference of 0.17%), Immigrants from Singapore (4.9%, a difference of 0.21%), and Chinese (4.9%, a difference of 0.26%).
| Demographics | Rating | Rank | Male Unemployment |
| British | 99.8 /100 | #30 | Exceptional 4.8% |
| Sudanese | 99.8 /100 | #31 | Exceptional 4.8% |
| Immigrants | Nepal | 99.8 /100 | #32 | Exceptional 4.8% |
| Latvians | 99.7 /100 | #33 | Exceptional 4.8% |
| Welsh | 99.7 /100 | #34 | Exceptional 4.8% |
| Paraguayans | 99.5 /100 | #35 | Exceptional 4.9% |
| Immigrants | Singapore | 99.4 /100 | #36 | Exceptional 4.9% |
| Scotch-Irish | 99.4 /100 | #37 | Exceptional 4.9% |
| Immigrants | Bosnia and Herzegovina | 99.4 /100 | #38 | Exceptional 4.9% |
| Burmese | 99.3 /100 | #39 | Exceptional 4.9% |
| Northern Europeans | 99.3 /100 | #40 | Exceptional 4.9% |
| Chinese | 99.3 /100 | #41 | Exceptional 4.9% |
| Immigrants | Belgium | 99.2 /100 | #42 | Exceptional 4.9% |
| Immigrants | Japan | 99.2 /100 | #43 | Exceptional 4.9% |
| Immigrants | Korea | 99.1 /100 | #44 | Exceptional 4.9% |
Demographics Similar to Africans by Male Unemployment
In terms of male unemployment, the demographic groups most similar to Africans are Central American Indian (6.3%, a difference of 0.29%), Immigrants from Senegal (6.3%, a difference of 0.33%), Immigrants from Ecuador (6.2%, a difference of 0.43%), Spanish American Indian (6.2%, a difference of 0.45%), and Immigrants from Caribbean (6.3%, a difference of 0.45%).
| Demographics | Rating | Rank | Male Unemployment |
| Ghanaians | 0.0 /100 | #279 | Tragic 6.1% |
| Immigrants | Ghana | 0.0 /100 | #280 | Tragic 6.2% |
| Sierra Leoneans | 0.0 /100 | #281 | Tragic 6.2% |
| Ecuadorians | 0.0 /100 | #282 | Tragic 6.2% |
| Immigrants | Western Africa | 0.0 /100 | #283 | Tragic 6.2% |
| Spanish American Indians | 0.0 /100 | #284 | Tragic 6.2% |
| Immigrants | Ecuador | 0.0 /100 | #285 | Tragic 6.2% |
| Africans | 0.0 /100 | #286 | Tragic 6.3% |
| Central American Indians | 0.0 /100 | #287 | Tragic 6.3% |
| Immigrants | Senegal | 0.0 /100 | #288 | Tragic 6.3% |
| Immigrants | Caribbean | 0.0 /100 | #289 | Tragic 6.3% |
| U.S. Virgin Islanders | 0.0 /100 | #290 | Tragic 6.4% |
| Immigrants | Azores | 0.0 /100 | #291 | Tragic 6.4% |
| Nepalese | 0.0 /100 | #292 | Tragic 6.4% |
| Haitians | 0.0 /100 | #293 | Tragic 6.4% |