Spanish American vs African Male Unemployment
COMPARE
Spanish American
African
Male Unemployment
Male Unemployment Comparison
Spanish Americans
Africans
5.7%
MALE UNEMPLOYMENT
0.3/ 100
METRIC RATING
251st/ 347
METRIC RANK
6.3%
MALE UNEMPLOYMENT
0.0/ 100
METRIC RATING
286th/ 347
METRIC RANK
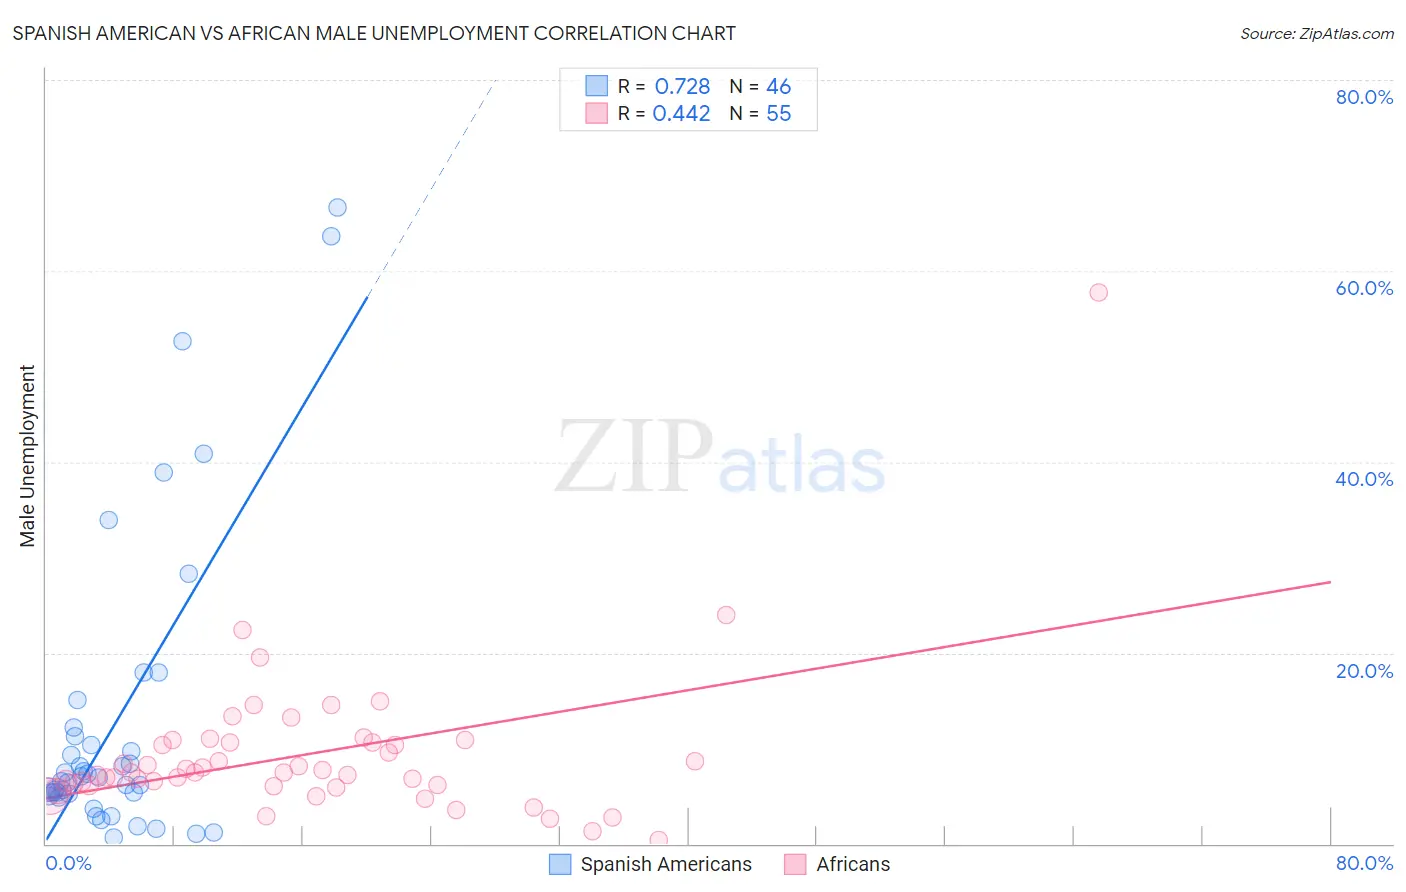
Spanish American vs African Male Unemployment Correlation Chart
The statistical analysis conducted on geographies consisting of 103,047,873 people shows a strong positive correlation between the proportion of Spanish Americans and unemployment rate among males in the United States with a correlation coefficient (R) of 0.728 and weighted average of 5.7%. Similarly, the statistical analysis conducted on geographies consisting of 467,193,011 people shows a moderate positive correlation between the proportion of Africans and unemployment rate among males in the United States with a correlation coefficient (R) of 0.442 and weighted average of 6.3%, a difference of 9.1%.
Male Unemployment Correlation Summary
| Measurement | Spanish American | African |
| Minimum | 0.60% | 0.40% |
| Maximum | 66.7% | 57.8% |
| Range | 66.1% | 57.4% |
| Mean | 12.8% | 9.3% |
| Median | 6.7% | 7.5% |
| Interquartile 25% (IQ1) | 5.2% | 6.1% |
| Interquartile 75% (IQ3) | 11.3% | 10.6% |
| Interquartile Range (IQR) | 6.1% | 4.5% |
| Standard Deviation (Sample) | 15.8% | 8.1% |
| Standard Deviation (Population) | 15.7% | 8.0% |
Similar Demographics by Male Unemployment
Demographics Similar to Spanish Americans by Male Unemployment
In terms of male unemployment, the demographic groups most similar to Spanish Americans are Immigrants from Bahamas (5.7%, a difference of 0.040%), Cree (5.7%, a difference of 0.29%), Marshallese (5.7%, a difference of 0.36%), Mexican (5.8%, a difference of 0.57%), and Hawaiian (5.7%, a difference of 0.68%).
| Demographics | Rating | Rank | Male Unemployment |
| Immigrants | El Salvador | 0.7 /100 | #244 | Tragic 5.7% |
| Yaqui | 0.7 /100 | #245 | Tragic 5.7% |
| Iroquois | 0.6 /100 | #246 | Tragic 5.7% |
| Hawaiians | 0.6 /100 | #247 | Tragic 5.7% |
| Marshallese | 0.5 /100 | #248 | Tragic 5.7% |
| Cree | 0.4 /100 | #249 | Tragic 5.7% |
| Immigrants | Bahamas | 0.4 /100 | #250 | Tragic 5.7% |
| Spanish Americans | 0.3 /100 | #251 | Tragic 5.7% |
| Mexicans | 0.2 /100 | #252 | Tragic 5.8% |
| Mexican American Indians | 0.2 /100 | #253 | Tragic 5.8% |
| Japanese | 0.2 /100 | #254 | Tragic 5.8% |
| Kiowa | 0.2 /100 | #255 | Tragic 5.8% |
| Comanche | 0.2 /100 | #256 | Tragic 5.8% |
| Hispanics or Latinos | 0.1 /100 | #257 | Tragic 5.8% |
| Dutch West Indians | 0.1 /100 | #258 | Tragic 5.8% |
Demographics Similar to Africans by Male Unemployment
In terms of male unemployment, the demographic groups most similar to Africans are Central American Indian (6.3%, a difference of 0.29%), Immigrants from Senegal (6.3%, a difference of 0.33%), Immigrants from Ecuador (6.2%, a difference of 0.43%), Spanish American Indian (6.2%, a difference of 0.45%), and Immigrants from Caribbean (6.3%, a difference of 0.45%).
| Demographics | Rating | Rank | Male Unemployment |
| Ghanaians | 0.0 /100 | #279 | Tragic 6.1% |
| Immigrants | Ghana | 0.0 /100 | #280 | Tragic 6.2% |
| Sierra Leoneans | 0.0 /100 | #281 | Tragic 6.2% |
| Ecuadorians | 0.0 /100 | #282 | Tragic 6.2% |
| Immigrants | Western Africa | 0.0 /100 | #283 | Tragic 6.2% |
| Spanish American Indians | 0.0 /100 | #284 | Tragic 6.2% |
| Immigrants | Ecuador | 0.0 /100 | #285 | Tragic 6.2% |
| Africans | 0.0 /100 | #286 | Tragic 6.3% |
| Central American Indians | 0.0 /100 | #287 | Tragic 6.3% |
| Immigrants | Senegal | 0.0 /100 | #288 | Tragic 6.3% |
| Immigrants | Caribbean | 0.0 /100 | #289 | Tragic 6.3% |
| U.S. Virgin Islanders | 0.0 /100 | #290 | Tragic 6.4% |
| Immigrants | Azores | 0.0 /100 | #291 | Tragic 6.4% |
| Nepalese | 0.0 /100 | #292 | Tragic 6.4% |
| Haitians | 0.0 /100 | #293 | Tragic 6.4% |