Cheyenne vs Nicaraguan In Labor Force | Age 20-64
COMPARE
Cheyenne
Nicaraguan
In Labor Force | Age 20-64
In Labor Force | Age 20-64 Comparison
Cheyenne
Nicaraguans
74.8%
IN LABOR FORCE | AGE 20-64
0.0/ 100
METRIC RATING
329th/ 347
METRIC RANK
79.3%
IN LABOR FORCE | AGE 20-64
18.3/ 100
METRIC RATING
202nd/ 347
METRIC RANK
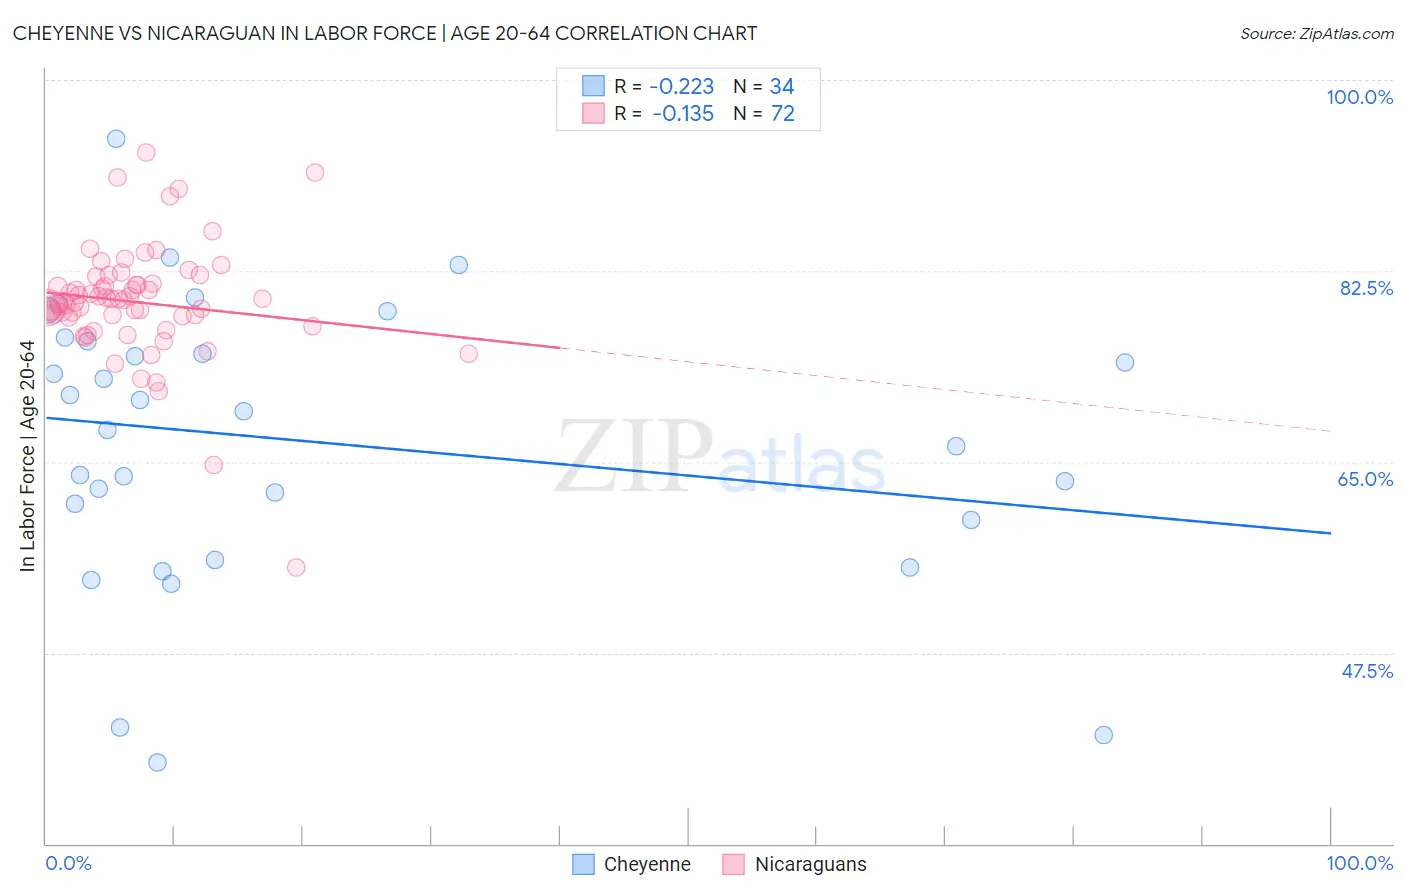
Cheyenne vs Nicaraguan In Labor Force | Age 20-64 Correlation Chart
The statistical analysis conducted on geographies consisting of 80,710,794 people shows a weak negative correlation between the proportion of Cheyenne and labor force participation rate among population between the ages 20 and 64 in the United States with a correlation coefficient (R) of -0.223 and weighted average of 74.8%. Similarly, the statistical analysis conducted on geographies consisting of 285,718,897 people shows a poor negative correlation between the proportion of Nicaraguans and labor force participation rate among population between the ages 20 and 64 in the United States with a correlation coefficient (R) of -0.135 and weighted average of 79.3%, a difference of 6.0%.
In Labor Force | Age 20-64 Correlation Summary
| Measurement | Cheyenne | Nicaraguan |
| Minimum | 37.5% | 55.3% |
| Maximum | 94.6% | 93.3% |
| Range | 57.1% | 38.0% |
| Mean | 66.9% | 79.7% |
| Median | 68.8% | 79.8% |
| Interquartile 25% (IQ1) | 59.7% | 78.3% |
| Interquartile 75% (IQ3) | 76.1% | 81.3% |
| Interquartile Range (IQR) | 16.4% | 3.0% |
| Standard Deviation (Sample) | 13.0% | 5.3% |
| Standard Deviation (Population) | 12.8% | 5.3% |
Similar Demographics by In Labor Force | Age 20-64
Demographics Similar to Cheyenne by In Labor Force | Age 20-64
In terms of in labor force | age 20-64, the demographic groups most similar to Cheyenne are Colville (74.8%, a difference of 0.070%), Kiowa (75.0%, a difference of 0.20%), Paiute (74.7%, a difference of 0.20%), Sioux (75.0%, a difference of 0.23%), and Creek (75.1%, a difference of 0.40%).
| Demographics | Rating | Rank | In Labor Force | Age 20-64 |
| Dutch West Indians | 0.0 /100 | #322 | Tragic 75.5% |
| Cajuns | 0.0 /100 | #323 | Tragic 75.5% |
| Choctaw | 0.0 /100 | #324 | Tragic 75.4% |
| Menominee | 0.0 /100 | #325 | Tragic 75.3% |
| Creek | 0.0 /100 | #326 | Tragic 75.1% |
| Sioux | 0.0 /100 | #327 | Tragic 75.0% |
| Kiowa | 0.0 /100 | #328 | Tragic 75.0% |
| Cheyenne | 0.0 /100 | #329 | Tragic 74.8% |
| Colville | 0.0 /100 | #330 | Tragic 74.8% |
| Paiute | 0.0 /100 | #331 | Tragic 74.7% |
| Arapaho | 0.0 /100 | #332 | Tragic 74.4% |
| Natives/Alaskans | 0.0 /100 | #333 | Tragic 73.9% |
| Apache | 0.0 /100 | #334 | Tragic 73.7% |
| Ute | 0.0 /100 | #335 | Tragic 73.7% |
| Crow | 0.0 /100 | #336 | Tragic 73.3% |
Demographics Similar to Nicaraguans by In Labor Force | Age 20-64
In terms of in labor force | age 20-64, the demographic groups most similar to Nicaraguans are Immigrants from Oceania (79.3%, a difference of 0.010%), Immigrants from Nicaragua (79.3%, a difference of 0.010%), Iraqi (79.3%, a difference of 0.010%), Immigrants from Cambodia (79.3%, a difference of 0.010%), and Immigrants from Congo (79.3%, a difference of 0.010%).
| Demographics | Rating | Rank | In Labor Force | Age 20-64 |
| Immigrants | Austria | 23.7 /100 | #195 | Fair 79.4% |
| Ecuadorians | 23.1 /100 | #196 | Fair 79.4% |
| Immigrants | Senegal | 22.5 /100 | #197 | Fair 79.4% |
| Immigrants | Laos | 21.5 /100 | #198 | Fair 79.4% |
| Dutch | 20.2 /100 | #199 | Fair 79.3% |
| Immigrants | Oceania | 19.1 /100 | #200 | Poor 79.3% |
| Immigrants | Nicaragua | 19.0 /100 | #201 | Poor 79.3% |
| Nicaraguans | 18.3 /100 | #202 | Poor 79.3% |
| Iraqis | 17.7 /100 | #203 | Poor 79.3% |
| Immigrants | Cambodia | 17.6 /100 | #204 | Poor 79.3% |
| Immigrants | Congo | 17.5 /100 | #205 | Poor 79.3% |
| Immigrants | Ecuador | 16.9 /100 | #206 | Poor 79.3% |
| Sub-Saharan Africans | 16.5 /100 | #207 | Poor 79.3% |
| British | 16.5 /100 | #208 | Poor 79.3% |
| Bangladeshis | 16.4 /100 | #209 | Poor 79.3% |