Immigrants from Belize vs Bermudan Unemployment Among Ages 25 to 29 years
COMPARE
Immigrants from Belize
Bermudan
Unemployment Among Ages 25 to 29 years
Unemployment Among Ages 25 to 29 years Comparison
Immigrants from Belize
Bermudans
7.8%
UNEMPLOYMENT AMONG AGES 25 TO 29 YEARS
0.0/ 100
METRIC RATING
293rd/ 347
METRIC RANK
7.0%
UNEMPLOYMENT AMONG AGES 25 TO 29 YEARS
3.8/ 100
METRIC RATING
229th/ 347
METRIC RANK
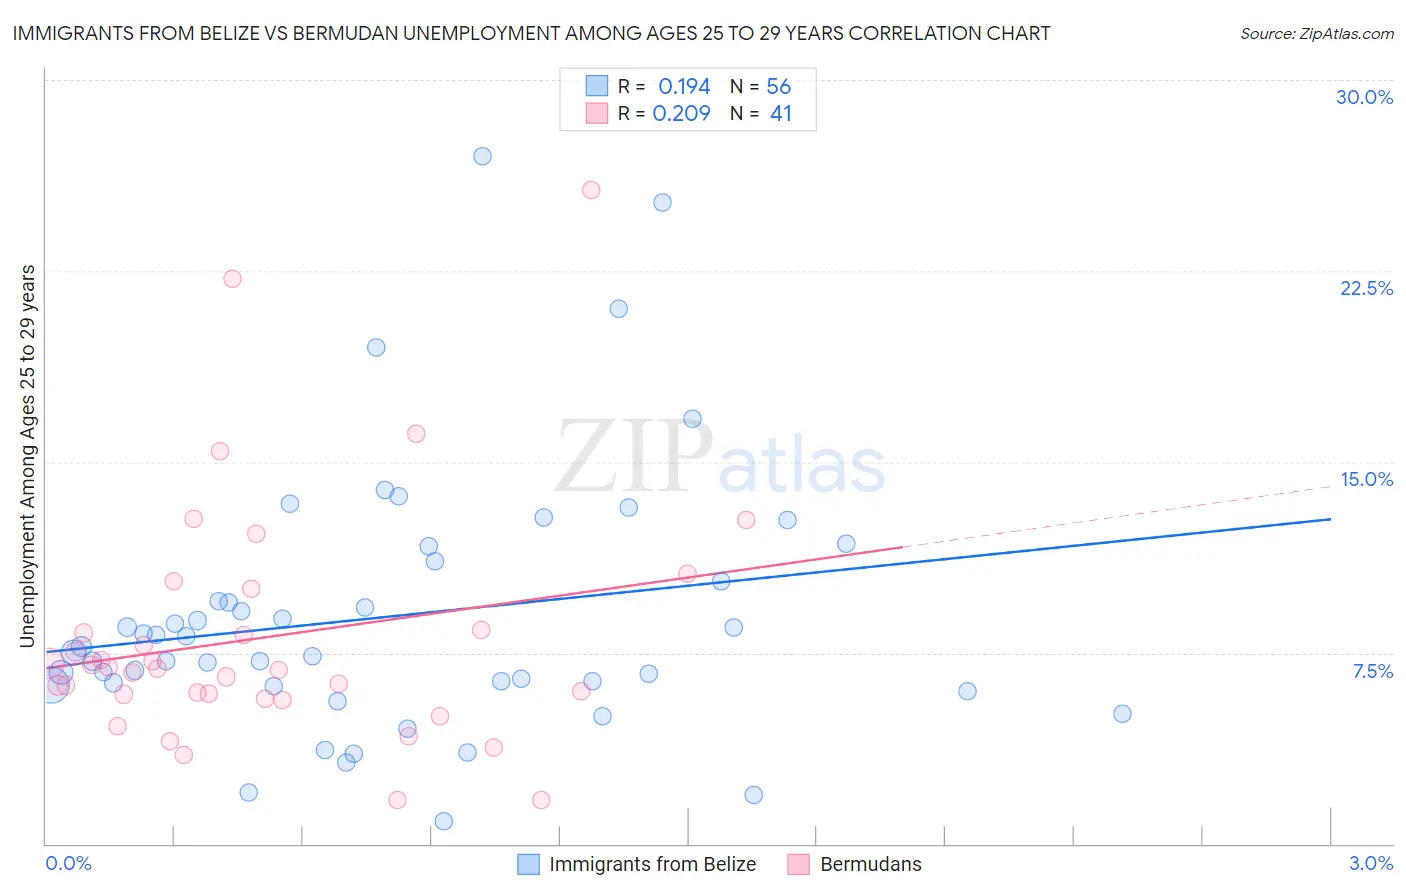
Immigrants from Belize vs Bermudan Unemployment Among Ages 25 to 29 years Correlation Chart
The statistical analysis conducted on geographies consisting of 128,941,417 people shows a poor positive correlation between the proportion of Immigrants from Belize and unemployment rate among population between the ages 25 and 29 in the United States with a correlation coefficient (R) of 0.194 and weighted average of 7.8%. Similarly, the statistical analysis conducted on geographies consisting of 55,384,018 people shows a weak positive correlation between the proportion of Bermudans and unemployment rate among population between the ages 25 and 29 in the United States with a correlation coefficient (R) of 0.209 and weighted average of 7.0%, a difference of 11.3%.
Unemployment Among Ages 25 to 29 years Correlation Summary
| Measurement | Immigrants from Belize | Bermudan |
| Minimum | 0.90% | 1.7% |
| Maximum | 27.0% | 25.7% |
| Range | 26.1% | 24.0% |
| Mean | 8.9% | 8.1% |
| Median | 7.6% | 6.9% |
| Interquartile 25% (IQ1) | 6.3% | 5.8% |
| Interquartile 75% (IQ3) | 10.7% | 9.2% |
| Interquartile Range (IQR) | 4.4% | 3.4% |
| Standard Deviation (Sample) | 5.2% | 4.8% |
| Standard Deviation (Population) | 5.1% | 4.8% |
Similar Demographics by Unemployment Among Ages 25 to 29 years
Demographics Similar to Immigrants from Belize by Unemployment Among Ages 25 to 29 years
In terms of unemployment among ages 25 to 29 years, the demographic groups most similar to Immigrants from Belize are Chippewa (7.8%, a difference of 0.050%), Trinidadian and Tobagonian (7.8%, a difference of 0.28%), Hispanic or Latino (7.7%, a difference of 0.46%), Comanche (7.8%, a difference of 0.74%), and Armenian (7.7%, a difference of 0.85%).
| Demographics | Rating | Rank | Unemployment Among Ages 25 to 29 years |
| Vietnamese | 0.0 /100 | #286 | Tragic 7.6% |
| Immigrants | Mexico | 0.0 /100 | #287 | Tragic 7.6% |
| Africans | 0.0 /100 | #288 | Tragic 7.6% |
| Belizeans | 0.0 /100 | #289 | Tragic 7.7% |
| Armenians | 0.0 /100 | #290 | Tragic 7.7% |
| Hispanics or Latinos | 0.0 /100 | #291 | Tragic 7.7% |
| Chippewa | 0.0 /100 | #292 | Tragic 7.8% |
| Immigrants | Belize | 0.0 /100 | #293 | Tragic 7.8% |
| Trinidadians and Tobagonians | 0.0 /100 | #294 | Tragic 7.8% |
| Comanche | 0.0 /100 | #295 | Tragic 7.8% |
| Immigrants | West Indies | 0.0 /100 | #296 | Tragic 7.8% |
| Blackfeet | 0.0 /100 | #297 | Tragic 7.9% |
| Immigrants | Trinidad and Tobago | 0.0 /100 | #298 | Tragic 7.9% |
| Barbadians | 0.0 /100 | #299 | Tragic 7.9% |
| Central American Indians | 0.0 /100 | #300 | Tragic 7.9% |
Demographics Similar to Bermudans by Unemployment Among Ages 25 to 29 years
In terms of unemployment among ages 25 to 29 years, the demographic groups most similar to Bermudans are Immigrants from El Salvador (7.0%, a difference of 0.080%), Immigrants from Panama (7.0%, a difference of 0.15%), Salvadoran (7.0%, a difference of 0.21%), Immigrants from Liberia (7.0%, a difference of 0.34%), and Central American (7.0%, a difference of 0.37%).
| Demographics | Rating | Rank | Unemployment Among Ages 25 to 29 years |
| Spaniards | 7.7 /100 | #222 | Tragic 6.9% |
| Celtics | 7.6 /100 | #223 | Tragic 6.9% |
| Immigrants | Immigrants | 6.2 /100 | #224 | Tragic 6.9% |
| Japanese | 5.4 /100 | #225 | Tragic 6.9% |
| Immigrants | Liberia | 4.8 /100 | #226 | Tragic 7.0% |
| Salvadorans | 4.4 /100 | #227 | Tragic 7.0% |
| Immigrants | Panama | 4.2 /100 | #228 | Tragic 7.0% |
| Bermudans | 3.8 /100 | #229 | Tragic 7.0% |
| Immigrants | El Salvador | 3.6 /100 | #230 | Tragic 7.0% |
| Central Americans | 3.0 /100 | #231 | Tragic 7.0% |
| Spanish Americans | 2.7 /100 | #232 | Tragic 7.0% |
| Immigrants | Honduras | 2.4 /100 | #233 | Tragic 7.0% |
| French Canadians | 2.4 /100 | #234 | Tragic 7.0% |
| Panamanians | 2.1 /100 | #235 | Tragic 7.0% |
| Cape Verdeans | 1.9 /100 | #236 | Tragic 7.0% |