Native Hawaiian vs Bermudan Unemployment Among Ages 25 to 29 years
COMPARE
Native Hawaiian
Bermudan
Unemployment Among Ages 25 to 29 years
Unemployment Among Ages 25 to 29 years Comparison
Native Hawaiians
Bermudans
7.1%
UNEMPLOYMENT AMONG AGES 25 TO 29 YEARS
1.3/ 100
METRIC RATING
240th/ 347
METRIC RANK
7.0%
UNEMPLOYMENT AMONG AGES 25 TO 29 YEARS
3.8/ 100
METRIC RATING
229th/ 347
METRIC RANK
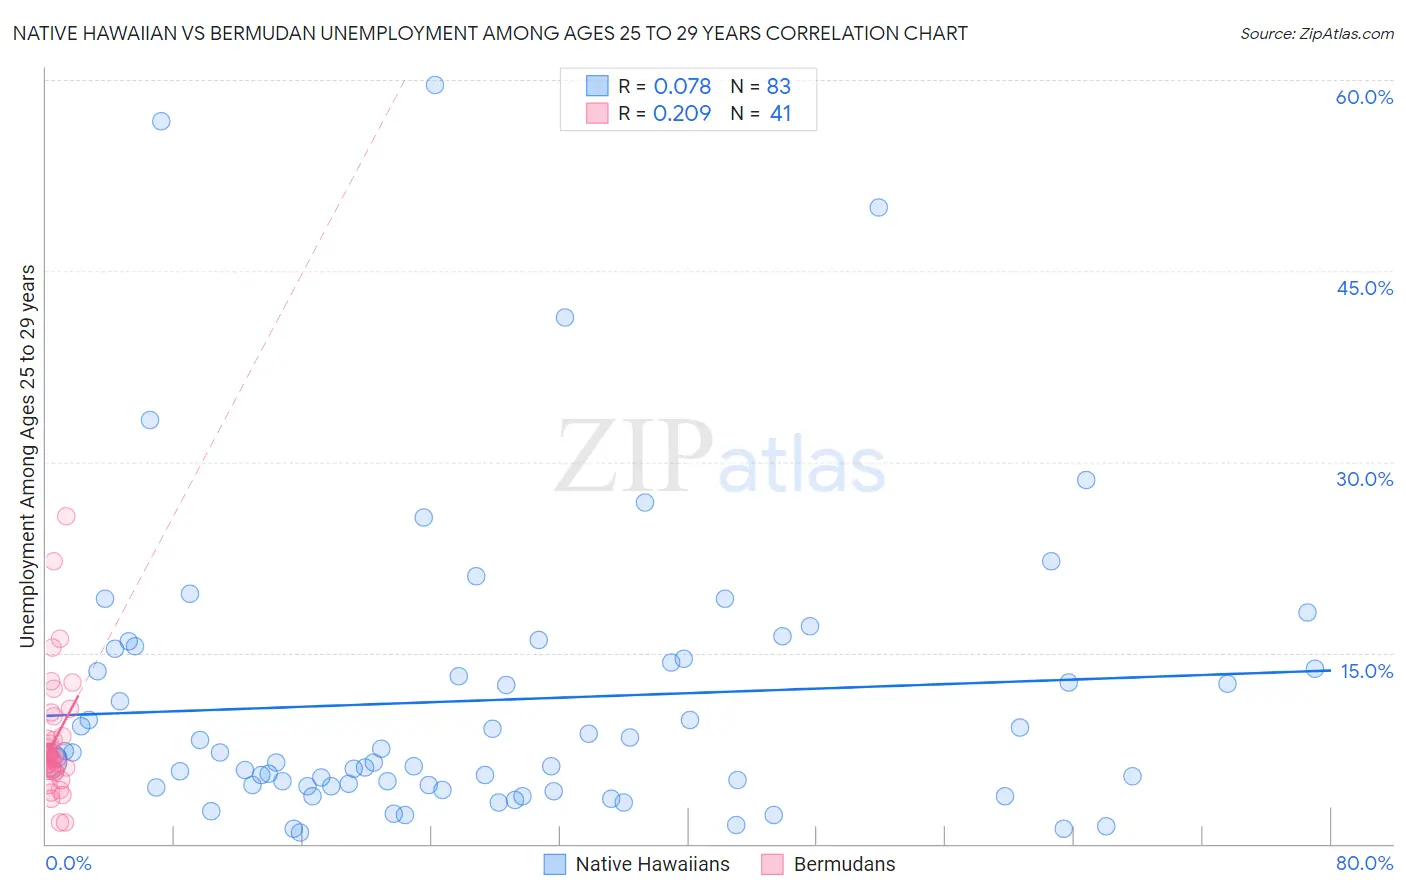
Native Hawaiian vs Bermudan Unemployment Among Ages 25 to 29 years Correlation Chart
The statistical analysis conducted on geographies consisting of 318,544,367 people shows a slight positive correlation between the proportion of Native Hawaiians and unemployment rate among population between the ages 25 and 29 in the United States with a correlation coefficient (R) of 0.078 and weighted average of 7.1%. Similarly, the statistical analysis conducted on geographies consisting of 55,384,018 people shows a weak positive correlation between the proportion of Bermudans and unemployment rate among population between the ages 25 and 29 in the United States with a correlation coefficient (R) of 0.209 and weighted average of 7.0%, a difference of 1.6%.
Unemployment Among Ages 25 to 29 years Correlation Summary
| Measurement | Native Hawaiian | Bermudan |
| Minimum | 0.90% | 1.7% |
| Maximum | 59.6% | 25.7% |
| Range | 58.7% | 24.0% |
| Mean | 11.3% | 8.1% |
| Median | 6.7% | 6.9% |
| Interquartile 25% (IQ1) | 4.5% | 5.8% |
| Interquartile 75% (IQ3) | 14.5% | 9.2% |
| Interquartile Range (IQR) | 10.0% | 3.4% |
| Standard Deviation (Sample) | 11.6% | 4.8% |
| Standard Deviation (Population) | 11.5% | 4.8% |
Demographics Similar to Native Hawaiians and Bermudans by Unemployment Among Ages 25 to 29 years
In terms of unemployment among ages 25 to 29 years, the demographic groups most similar to Native Hawaiians are Potawatomi (7.1%, a difference of 0.030%), Immigrants from Sierra Leone (7.1%, a difference of 0.040%), Spanish American Indian (7.1%, a difference of 0.30%), Yaqui (7.1%, a difference of 0.43%), and Nonimmigrants (7.1%, a difference of 0.47%). Similarly, the demographic groups most similar to Bermudans are Immigrants from El Salvador (7.0%, a difference of 0.080%), Immigrants from Panama (7.0%, a difference of 0.15%), Salvadoran (7.0%, a difference of 0.21%), Immigrants from Liberia (7.0%, a difference of 0.34%), and Central American (7.0%, a difference of 0.37%).
| Demographics | Rating | Rank | Unemployment Among Ages 25 to 29 years |
| Immigrants | Immigrants | 6.2 /100 | #224 | Tragic 6.9% |
| Japanese | 5.4 /100 | #225 | Tragic 6.9% |
| Immigrants | Liberia | 4.8 /100 | #226 | Tragic 7.0% |
| Salvadorans | 4.4 /100 | #227 | Tragic 7.0% |
| Immigrants | Panama | 4.2 /100 | #228 | Tragic 7.0% |
| Bermudans | 3.8 /100 | #229 | Tragic 7.0% |
| Immigrants | El Salvador | 3.6 /100 | #230 | Tragic 7.0% |
| Central Americans | 3.0 /100 | #231 | Tragic 7.0% |
| Spanish Americans | 2.7 /100 | #232 | Tragic 7.0% |
| Immigrants | Honduras | 2.4 /100 | #233 | Tragic 7.0% |
| French Canadians | 2.4 /100 | #234 | Tragic 7.0% |
| Panamanians | 2.1 /100 | #235 | Tragic 7.0% |
| Cape Verdeans | 1.9 /100 | #236 | Tragic 7.0% |
| Puget Sound Salish | 1.8 /100 | #237 | Tragic 7.1% |
| Hondurans | 1.8 /100 | #238 | Tragic 7.1% |
| Potawatomi | 1.3 /100 | #239 | Tragic 7.1% |
| Native Hawaiians | 1.3 /100 | #240 | Tragic 7.1% |
| Immigrants | Sierra Leone | 1.3 /100 | #241 | Tragic 7.1% |
| Spanish American Indians | 1.1 /100 | #242 | Tragic 7.1% |
| Yaqui | 1.0 /100 | #243 | Tragic 7.1% |
| Immigrants | Nonimmigrants | 0.9 /100 | #244 | Tragic 7.1% |