Dutch vs Bermudan Unemployment Among Ages 25 to 29 years
COMPARE
Dutch
Bermudan
Unemployment Among Ages 25 to 29 years
Unemployment Among Ages 25 to 29 years Comparison
Dutch
Bermudans
6.5%
UNEMPLOYMENT AMONG AGES 25 TO 29 YEARS
80.6/ 100
METRIC RATING
127th/ 347
METRIC RANK
7.0%
UNEMPLOYMENT AMONG AGES 25 TO 29 YEARS
3.8/ 100
METRIC RATING
229th/ 347
METRIC RANK
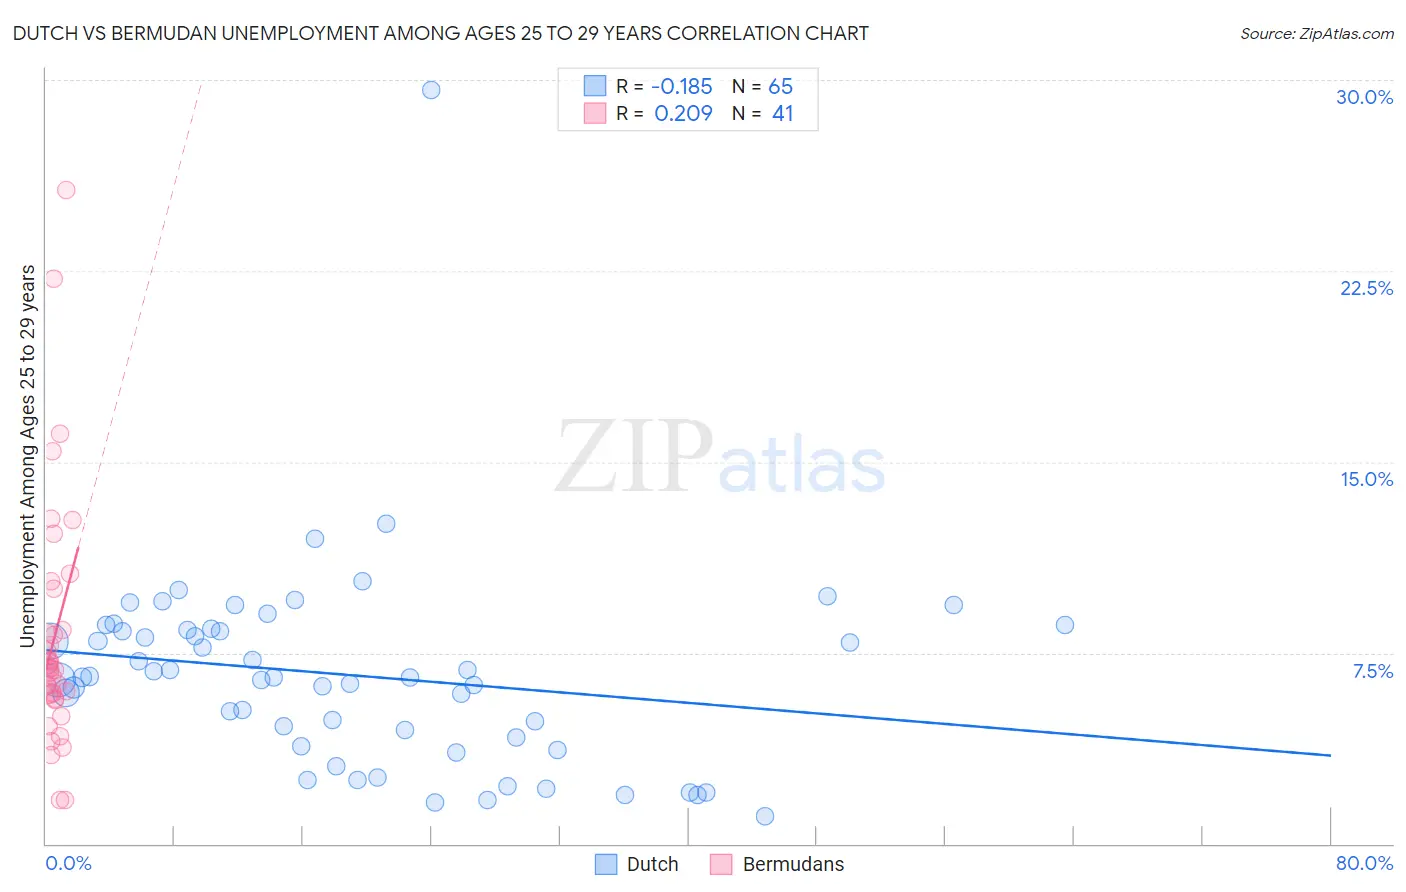
Dutch vs Bermudan Unemployment Among Ages 25 to 29 years Correlation Chart
The statistical analysis conducted on geographies consisting of 494,818,360 people shows a poor negative correlation between the proportion of Dutch and unemployment rate among population between the ages 25 and 29 in the United States with a correlation coefficient (R) of -0.185 and weighted average of 6.5%. Similarly, the statistical analysis conducted on geographies consisting of 55,384,018 people shows a weak positive correlation between the proportion of Bermudans and unemployment rate among population between the ages 25 and 29 in the United States with a correlation coefficient (R) of 0.209 and weighted average of 7.0%, a difference of 7.3%.
Unemployment Among Ages 25 to 29 years Correlation Summary
| Measurement | Dutch | Bermudan |
| Minimum | 1.1% | 1.7% |
| Maximum | 29.6% | 25.7% |
| Range | 28.5% | 24.0% |
| Mean | 6.6% | 8.1% |
| Median | 6.5% | 6.9% |
| Interquartile 25% (IQ1) | 4.0% | 5.8% |
| Interquartile 75% (IQ3) | 8.4% | 9.2% |
| Interquartile Range (IQR) | 4.4% | 3.4% |
| Standard Deviation (Sample) | 4.0% | 4.8% |
| Standard Deviation (Population) | 4.0% | 4.8% |
Similar Demographics by Unemployment Among Ages 25 to 29 years
Demographics Similar to Dutch by Unemployment Among Ages 25 to 29 years
In terms of unemployment among ages 25 to 29 years, the demographic groups most similar to Dutch are Immigrants from Chile (6.5%, a difference of 0.020%), Sri Lankan (6.5%, a difference of 0.040%), Immigrants from Peru (6.5%, a difference of 0.070%), Brazilian (6.5%, a difference of 0.13%), and Immigrants from Afghanistan (6.5%, a difference of 0.14%).
| Demographics | Rating | Rank | Unemployment Among Ages 25 to 29 years |
| Immigrants | Moldova | 84.5 /100 | #120 | Excellent 6.5% |
| Immigrants | Uganda | 84.5 /100 | #121 | Excellent 6.5% |
| Immigrants | Belarus | 83.7 /100 | #122 | Excellent 6.5% |
| Laotians | 83.6 /100 | #123 | Excellent 6.5% |
| Arabs | 82.5 /100 | #124 | Excellent 6.5% |
| Syrians | 82.1 /100 | #125 | Excellent 6.5% |
| Brazilians | 81.9 /100 | #126 | Excellent 6.5% |
| Dutch | 80.6 /100 | #127 | Excellent 6.5% |
| Immigrants | Chile | 80.5 /100 | #128 | Excellent 6.5% |
| Sri Lankans | 80.3 /100 | #129 | Excellent 6.5% |
| Immigrants | Peru | 79.9 /100 | #130 | Good 6.5% |
| Immigrants | Afghanistan | 79.2 /100 | #131 | Good 6.5% |
| Poles | 76.6 /100 | #132 | Good 6.5% |
| Immigrants | Europe | 75.7 /100 | #133 | Good 6.5% |
| Immigrants | Vietnam | 75.6 /100 | #134 | Good 6.5% |
Demographics Similar to Bermudans by Unemployment Among Ages 25 to 29 years
In terms of unemployment among ages 25 to 29 years, the demographic groups most similar to Bermudans are Immigrants from El Salvador (7.0%, a difference of 0.080%), Immigrants from Panama (7.0%, a difference of 0.15%), Salvadoran (7.0%, a difference of 0.21%), Immigrants from Liberia (7.0%, a difference of 0.34%), and Central American (7.0%, a difference of 0.37%).
| Demographics | Rating | Rank | Unemployment Among Ages 25 to 29 years |
| Spaniards | 7.7 /100 | #222 | Tragic 6.9% |
| Celtics | 7.6 /100 | #223 | Tragic 6.9% |
| Immigrants | Immigrants | 6.2 /100 | #224 | Tragic 6.9% |
| Japanese | 5.4 /100 | #225 | Tragic 6.9% |
| Immigrants | Liberia | 4.8 /100 | #226 | Tragic 7.0% |
| Salvadorans | 4.4 /100 | #227 | Tragic 7.0% |
| Immigrants | Panama | 4.2 /100 | #228 | Tragic 7.0% |
| Bermudans | 3.8 /100 | #229 | Tragic 7.0% |
| Immigrants | El Salvador | 3.6 /100 | #230 | Tragic 7.0% |
| Central Americans | 3.0 /100 | #231 | Tragic 7.0% |
| Spanish Americans | 2.7 /100 | #232 | Tragic 7.0% |
| Immigrants | Honduras | 2.4 /100 | #233 | Tragic 7.0% |
| French Canadians | 2.4 /100 | #234 | Tragic 7.0% |
| Panamanians | 2.1 /100 | #235 | Tragic 7.0% |
| Cape Verdeans | 1.9 /100 | #236 | Tragic 7.0% |