Cherokee vs Cajun Unemployment Among Youth under 25 years

COMPARE

Cherokee
Race
Ancestry
AfghanAfricanAlaska NativeAlaskan AthabascanAlbanianAleutAlsatianAmericanApacheArabArapahoArgentineanArmenianAssyrian/Chaldean/SyriacAustralianAustrianBahamianBangladeshiBarbadianBasqueBelgianBelizeanBermudanBhutaneseBlackfeetBolivianBrazilianBritishBritish West IndianBulgarianBurmeseCambodianCanadianCape VerdeanCarpatho RusynCelticCentral AmericanCentral American IndianCherokeeCheyenneChickasawChileanChineseChippewaChoctawColombianColvilleComancheCosta RicanCreeCreekCroatianCrowCubanCypriotCzechCzechoslovakianDanishDelawareDominicanDutchDutch West IndianEastern EuropeanEcuadorianEgyptianEnglishEstonianEthiopianEuropeanFijianFilipinoFinnishFrenchFrench American IndianFrench CanadianGermanGerman RussianGhanaianGreekGuamanian/ChamorroGuatemalanGuyaneseHaitianHmongHonduranHopiHoumaHungarianIcelanderIndian (Asian)IndonesianInupiatIranianIraqiIrishIroquoisIsraeliItalianJamaicanJapaneseJordanianKenyanKiowaKoreanLaotianLatvianLebaneseLiberianLithuanianLumbeeLuxembourgerMacedonianMalaysianMalteseMarshalleseMenomineeMexicanMexican American IndianMongolianMoroccanNative HawaiianNavajoNepaleseNew ZealanderNicaraguanNigerianNorthern EuropeanNorwegianOkinawanOsageOttawaPaiutePakistaniPalestinianPanamanianParaguayanPennsylvania GermanPeruvianPimaPolishPortuguesePotawatomiPuebloPuerto RicanPuget Sound SalishRomanianRussianSalvadoranSamoanScandinavianScotch-IrishScottishSeminoleSenegaleseSerbianShoshoneSierra LeoneanSiouxSlavicSlovakSloveneSomaliSouth AfricanSouth AmericanSouth American IndianSoviet UnionSpaniardSpanishSpanish AmericanSpanish American IndianSri LankanSubsaharan AfricanSudaneseSwedishSwissSyrianTaiwaneseThaiTlingit-HaidaTohono O'OdhamTonganTrinidadian and TobagonianTsimshianTurkishU.S. Virgin IslanderUgandanUkrainianUruguayanUteVenezuelanVietnameseWelshWest IndianYakamaYaquiYugoslavianYumanYup'ikZimbabwean
Immigration
NonimmigrantsImmigrantsAfghanistanAfricaAlbaniaArgentinaArmeniaAsiaAustraliaAustriaBahamasBangladeshBarbadosBelarusBelgiumBelizeBoliviaBosnia and HerzegovinaBrazilBulgariaBurma/MyanmarCabo VerdeCambodiaCameroonCanadaCaribbeanCentral AmericaChileChinaColombiaCongoCosta RicaCroatiaCubaCzechoslovakiaDenmarkDominicaDominican RepublicEastern AfricaEastern AsiaEastern EuropeEcuadorEgyptEl SalvadorEnglandEritreaEthiopiaEuropeFijiFranceGermanyGhanaGreeceGrenadaGuatemalaGuyanaHaitiHondurasHong KongHungaryIndiaIndonesiaIranIraqIrelandIsraelItalyJamaicaJapanJordanKazakhstanKenyaKoreaKuwaitLaosLatin AmericaLatviaLebanonLiberiaLithuaniaMalaysiaMexicoMicronesiaMiddle AfricaMoldovaMoroccoNepalNetherlandsNicaraguaNigeriaNorth AmericaNorth MacedoniaNorthern AfricaNorthern EuropeNorwayOceaniaPakistanPanamaPeruPhilippinesPolandPortugalRomaniaRussiaSaudi ArabiaScotlandSenegalSerbiaSierra LeoneSingaporeSomaliaSouth AfricaSouth AmericaSouth Central AsiaSouth Eastern AsiaSouthern EuropeSpainSri LankaSt. Vincent and the GrenadinesSudanSwedenSwitzerlandSyriaTaiwanThailandTrinidad and TobagoTurkeyUgandaUkraineUruguayUzbekistanVenezuelaVietnamWest IndiesWestern AfricaWestern AsiaWestern EuropeYemenZaireZimbabweAzores
Cajun
Race
Ancestry
AfghanAfricanAlaska NativeAlaskan AthabascanAlbanianAleutAlsatianAmericanApacheArabArapahoArgentineanArmenianAssyrian/Chaldean/SyriacAustralianAustrianBahamianBangladeshiBarbadianBasqueBelgianBelizeanBermudanBhutaneseBlackfeetBolivianBrazilianBritishBritish West IndianBulgarianBurmeseCajunCambodianCanadianCape VerdeanCarpatho RusynCelticCentral AmericanCentral American IndianCheyenneChickasawChileanChineseChippewaChoctawColombianColvilleComancheCosta RicanCreeCreekCroatianCrowCubanCypriotCzechCzechoslovakianDanishDelawareDominicanDutchDutch West IndianEastern EuropeanEcuadorianEgyptianEnglishEstonianEthiopianEuropeanFijianFilipinoFinnishFrenchFrench American IndianFrench CanadianGermanGerman RussianGhanaianGreekGuamanian/ChamorroGuatemalanGuyaneseHaitianHmongHonduranHopiHoumaHungarianIcelanderIndian (Asian)IndonesianInupiatIranianIraqiIrishIroquoisIsraeliItalianJamaicanJapaneseJordanianKenyanKiowaKoreanLaotianLatvianLebaneseLiberianLithuanianLumbeeLuxembourgerMacedonianMalaysianMalteseMarshalleseMenomineeMexicanMexican American IndianMongolianMoroccanNative HawaiianNavajoNepaleseNew ZealanderNicaraguanNigerianNorthern EuropeanNorwegianOkinawanOsageOttawaPaiutePakistaniPalestinianPanamanianParaguayanPennsylvania GermanPeruvianPimaPolishPortuguesePotawatomiPuebloPuerto RicanPuget Sound SalishRomanianRussianSalvadoranSamoanScandinavianScotch-IrishScottishSeminoleSenegaleseSerbianShoshoneSierra LeoneanSiouxSlavicSlovakSloveneSomaliSouth AfricanSouth AmericanSouth American IndianSoviet UnionSpaniardSpanishSpanish AmericanSpanish American IndianSri LankanSubsaharan AfricanSudaneseSwedishSwissSyrianTaiwaneseThaiTlingit-HaidaTohono O'OdhamTonganTrinidadian and TobagonianTsimshianTurkishU.S. Virgin IslanderUgandanUkrainianUruguayanUteVenezuelanVietnameseWelshWest IndianYakamaYaquiYugoslavianYumanYup'ikZimbabwean
Immigration
NonimmigrantsImmigrantsAfghanistanAfricaAlbaniaArgentinaArmeniaAsiaAustraliaAustriaBahamasBangladeshBarbadosBelarusBelgiumBelizeBoliviaBosnia and HerzegovinaBrazilBulgariaBurma/MyanmarCabo VerdeCambodiaCameroonCanadaCaribbeanCentral AmericaChileChinaColombiaCongoCosta RicaCroatiaCubaCzechoslovakiaDenmarkDominicaDominican RepublicEastern AfricaEastern AsiaEastern EuropeEcuadorEgyptEl SalvadorEnglandEritreaEthiopiaEuropeFijiFranceGermanyGhanaGreeceGrenadaGuatemalaGuyanaHaitiHondurasHong KongHungaryIndiaIndonesiaIranIraqIrelandIsraelItalyJamaicaJapanJordanKazakhstanKenyaKoreaKuwaitLaosLatin AmericaLatviaLebanonLiberiaLithuaniaMalaysiaMexicoMicronesiaMiddle AfricaMoldovaMoroccoNepalNetherlandsNicaraguaNigeriaNorth AmericaNorth MacedoniaNorthern AfricaNorthern EuropeNorwayOceaniaPakistanPanamaPeruPhilippinesPolandPortugalRomaniaRussiaSaudi ArabiaScotlandSenegalSerbiaSierra LeoneSingaporeSomaliaSouth AfricaSouth AmericaSouth Central AsiaSouth Eastern AsiaSouthern EuropeSpainSri LankaSt. Vincent and the GrenadinesSudanSwedenSwitzerlandSyriaTaiwanThailandTrinidad and TobagoTurkeyUgandaUkraineUruguayUzbekistanVenezuelaVietnamWest IndiesWestern AfricaWestern AsiaWestern EuropeYemenZaireZimbabweAzores
Unemployment Among Youth under 25 years
Income
Poverty
Unemployment
Labor Participation
Family Structure
Vehicle Availability
Education Level
Disability

Unemployment Among Youth under 25 years Comparison

Cherokee

Cajuns

Fair
Tragic
11.8%
UNEMPLOYMENT AMONG YOUTH UNDER 25 YEARS
21.2/ 100
METRIC RATING
198th/ 347
METRIC RANK
13.2%
UNEMPLOYMENT AMONG YOUTH UNDER 25 YEARS
0.0/ 100
METRIC RATING
279th/ 347
METRIC RANK

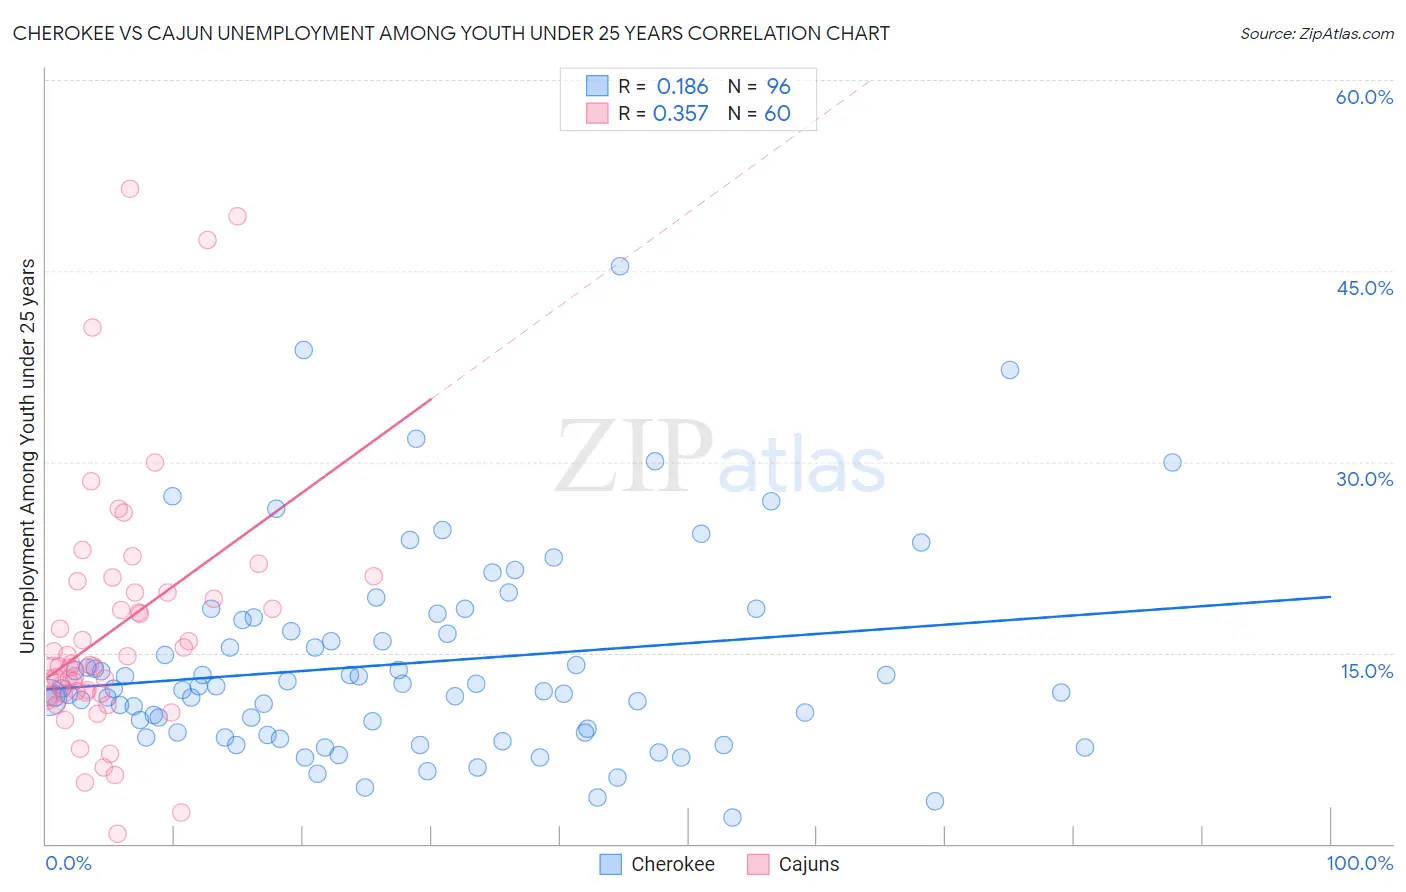
Cherokee vs Cajun Unemployment Among Youth under 25 years Correlation Chart

The statistical analysis conducted on geographies consisting of 481,576,104 people shows a poor positive correlation between the proportion of Cherokee and unemployment rate among youth under the age of 25 in the United States with a correlation coefficient (R) of 0.186 and weighted average of 11.8%. Similarly, the statistical analysis conducted on geographies consisting of 148,147,814 people shows a mild positive correlation between the proportion of Cajuns and unemployment rate among youth under the age of 25 in the United States with a correlation coefficient (R) of 0.357 and weighted average of 13.2%, a difference of 12.6%.
Cherokee vs Cajun Unemployment Among Youth under 25 years

Unemployment Among Youth under 25 years Correlation Summary

MeasurementCherokeeCajun
Minimum2.1%0.80%
Maximum45.4%51.5%
Range43.3%50.7%
Mean14.2%16.9%
Median12.2%14.0%
Interquartile 25% (IQ1)8.8%11.8%
Interquartile 75% (IQ3)17.1%19.8%
Interquartile Range (IQR)8.3%8.0%
Standard Deviation (Sample)7.9%10.1%
Standard Deviation (Population)7.8%10.0%

Similar Demographics by Unemployment Among Youth under 25 years

Demographics Similar to Cherokee by Unemployment Among Youth under 25 years

In terms of unemployment among youth under 25 years, the demographic groups most similar to Cherokee are Immigrants from Colombia (11.8%, a difference of 0.020%), Korean (11.7%, a difference of 0.16%), Arab (11.8%, a difference of 0.20%), Egyptian (11.7%, a difference of 0.32%), and Paraguayan (11.7%, a difference of 0.33%).
DemographicsRating | RankUnemployment Among Youth under 25 years
Cypriots
28.5
/100
|
#191
Fair
11.7%
Immigrants | Russia
28.5
/100
|
#192
Fair
11.7%
Seminole
27.9
/100
|
#193
Fair
11.7%
Immigrants | Sri Lanka
27.8
/100
|
#194
Fair
11.7%
Paraguayans
27.2
/100
|
#195
Fair
11.7%
Egyptians
26.9
/100
|
#196
Fair
11.7%
Koreans
23.9
/100
|
#197
Fair
11.7%
Cherokee
21.2
/100
|
#198
Fair
11.8%
Immigrants | Colombia
20.9
/100
|
#199
Fair
11.8%
Arabs
18.0
/100
|
#200
Poor
11.8%
Palestinians
16.0
/100
|
#201
Poor
11.8%
Marshallese
15.8
/100
|
#202
Poor
11.8%
Immigrants | Peru
15.3
/100
|
#203
Poor
11.8%
Immigrants | Costa Rica
15.2
/100
|
#204
Poor
11.8%
Peruvians
14.0
/100
|
#205
Poor
11.8%

Demographics Similar to Cajuns by Unemployment Among Youth under 25 years

In terms of unemployment among youth under 25 years, the demographic groups most similar to Cajuns are Ute (13.3%, a difference of 0.25%), Armenian (13.3%, a difference of 0.28%), Sierra Leonean (13.3%, a difference of 0.29%), Immigrants from Cameroon (13.3%, a difference of 0.32%), and Lumbee (13.3%, a difference of 0.33%).
DemographicsRating | RankUnemployment Among Youth under 25 years
Cape Verdeans
0.0
/100
|
#272
Tragic
12.9%
Nigerians
0.0
/100
|
#273
Tragic
13.0%
Immigrants | Nigeria
0.0
/100
|
#274
Tragic
13.0%
Bermudans
0.0
/100
|
#275
Tragic
13.0%
Immigrants | Uzbekistan
0.0
/100
|
#276
Tragic
13.1%
Bahamians
0.0
/100
|
#277
Tragic
13.1%
Africans
0.0
/100
|
#278
Tragic
13.2%
Cajuns
0.0
/100
|
#279
Tragic
13.2%
Ute
0.0
/100
|
#280
Tragic
13.3%
Armenians
0.0
/100
|
#281
Tragic
13.3%
Sierra Leoneans
0.0
/100
|
#282
Tragic
13.3%
Immigrants | Cameroon
0.0
/100
|
#283
Tragic
13.3%
Lumbee
0.0
/100
|
#284
Tragic
13.3%
Ghanaians
0.0
/100
|
#285
Tragic
13.3%
Blackfeet
0.0
/100
|
#286
Tragic
13.3%