Cree vs Cajun Unemployment Among Youth under 25 years
COMPARE
Cree
Cajun
Unemployment Among Youth under 25 years
Unemployment Among Youth under 25 years Comparison
Cree
Cajuns
12.4%
UNEMPLOYMENT AMONG YOUTH UNDER 25 YEARS
0.1/ 100
METRIC RATING
263rd/ 347
METRIC RANK
13.2%
UNEMPLOYMENT AMONG YOUTH UNDER 25 YEARS
0.0/ 100
METRIC RATING
279th/ 347
METRIC RANK
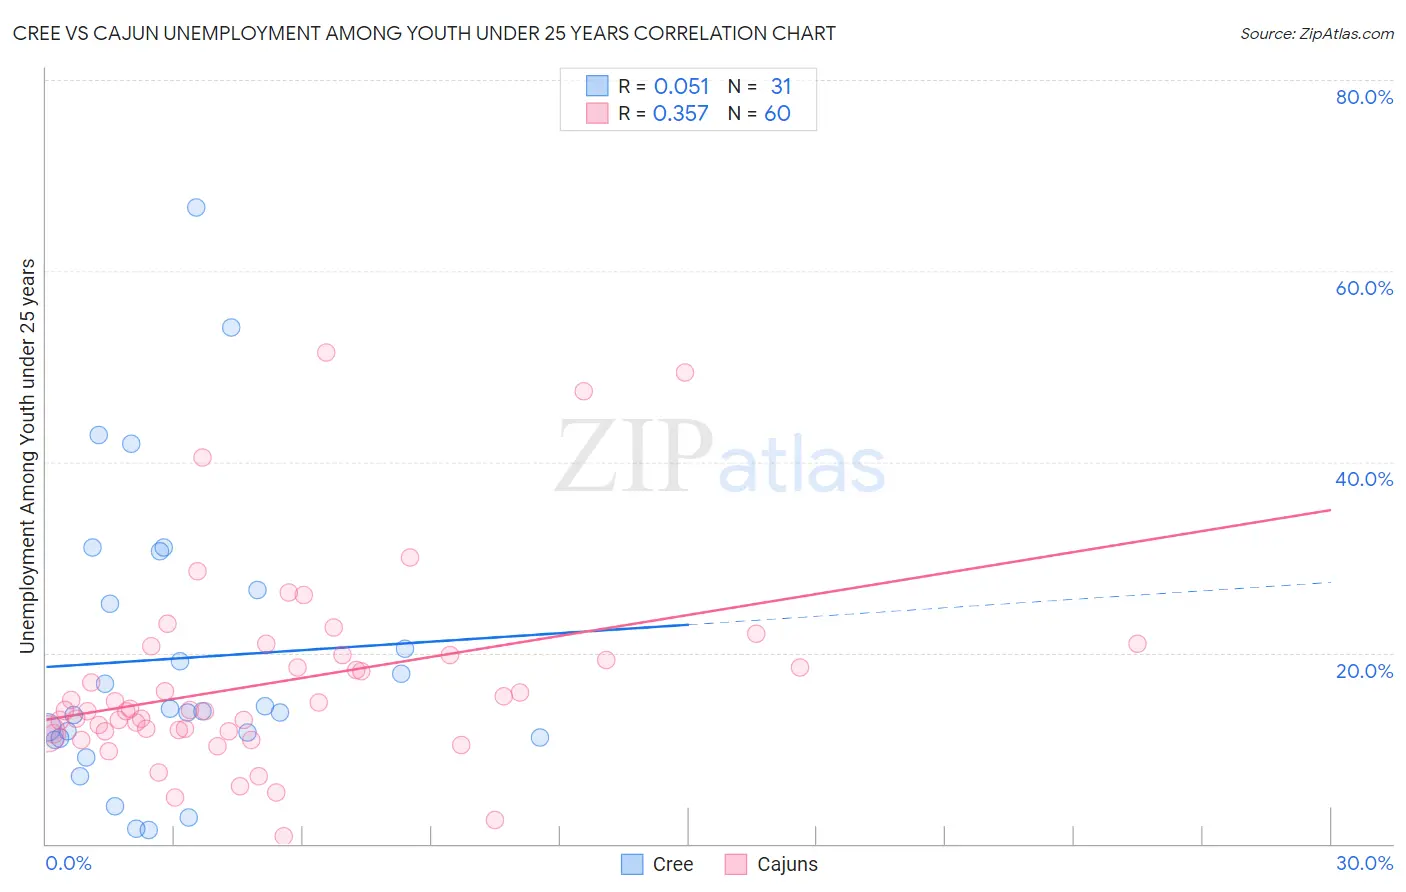
Cree vs Cajun Unemployment Among Youth under 25 years Correlation Chart
The statistical analysis conducted on geographies consisting of 75,921,108 people shows a slight positive correlation between the proportion of Cree and unemployment rate among youth under the age of 25 in the United States with a correlation coefficient (R) of 0.051 and weighted average of 12.4%. Similarly, the statistical analysis conducted on geographies consisting of 148,147,814 people shows a mild positive correlation between the proportion of Cajuns and unemployment rate among youth under the age of 25 in the United States with a correlation coefficient (R) of 0.357 and weighted average of 13.2%, a difference of 6.4%.
Unemployment Among Youth under 25 years Correlation Summary
| Measurement | Cree | Cajun |
| Minimum | 1.5% | 0.80% |
| Maximum | 66.6% | 51.5% |
| Range | 65.1% | 50.7% |
| Mean | 19.4% | 16.9% |
| Median | 13.9% | 14.0% |
| Interquartile 25% (IQ1) | 11.1% | 11.8% |
| Interquartile 75% (IQ3) | 26.6% | 19.8% |
| Interquartile Range (IQR) | 15.5% | 8.0% |
| Standard Deviation (Sample) | 15.2% | 10.1% |
| Standard Deviation (Population) | 15.0% | 10.0% |
Demographics Similar to Cree and Cajuns by Unemployment Among Youth under 25 years
In terms of unemployment among youth under 25 years, the demographic groups most similar to Cree are Immigrants from Mexico (12.4%, a difference of 0.090%), Immigrants from El Salvador (12.4%, a difference of 0.14%), Puget Sound Salish (12.5%, a difference of 0.47%), Nepalese (12.5%, a difference of 0.57%), and Immigrants from Latin America (12.6%, a difference of 1.5%). Similarly, the demographic groups most similar to Cajuns are Ute (13.3%, a difference of 0.25%), Armenian (13.3%, a difference of 0.28%), African (13.2%, a difference of 0.67%), Bahamian (13.1%, a difference of 0.92%), and Immigrants from Uzbekistan (13.1%, a difference of 1.1%).
| Demographics | Rating | Rank | Unemployment Among Youth under 25 years |
| Immigrants | El Salvador | 0.1 /100 | #261 | Tragic 12.4% |
| Immigrants | Mexico | 0.1 /100 | #262 | Tragic 12.4% |
| Cree | 0.1 /100 | #263 | Tragic 12.4% |
| Puget Sound Salish | 0.1 /100 | #264 | Tragic 12.5% |
| Nepalese | 0.0 /100 | #265 | Tragic 12.5% |
| Immigrants | Latin America | 0.0 /100 | #266 | Tragic 12.6% |
| Sub-Saharan Africans | 0.0 /100 | #267 | Tragic 12.6% |
| Tlingit-Haida | 0.0 /100 | #268 | Tragic 12.7% |
| Kiowa | 0.0 /100 | #269 | Tragic 12.7% |
| Immigrants | Liberia | 0.0 /100 | #270 | Tragic 12.8% |
| Immigrants | Bahamas | 0.0 /100 | #271 | Tragic 12.9% |
| Cape Verdeans | 0.0 /100 | #272 | Tragic 12.9% |
| Nigerians | 0.0 /100 | #273 | Tragic 13.0% |
| Immigrants | Nigeria | 0.0 /100 | #274 | Tragic 13.0% |
| Bermudans | 0.0 /100 | #275 | Tragic 13.0% |
| Immigrants | Uzbekistan | 0.0 /100 | #276 | Tragic 13.1% |
| Bahamians | 0.0 /100 | #277 | Tragic 13.1% |
| Africans | 0.0 /100 | #278 | Tragic 13.2% |
| Cajuns | 0.0 /100 | #279 | Tragic 13.2% |
| Ute | 0.0 /100 | #280 | Tragic 13.3% |
| Armenians | 0.0 /100 | #281 | Tragic 13.3% |