Basque vs Cajun Unemployment Among Youth under 25 years
COMPARE
Basque
Cajun
Unemployment Among Youth under 25 years
Unemployment Among Youth under 25 years Comparison
Basques
Cajuns
11.4%
UNEMPLOYMENT AMONG YOUTH UNDER 25 YEARS
87.8/ 100
METRIC RATING
123rd/ 347
METRIC RANK
13.2%
UNEMPLOYMENT AMONG YOUTH UNDER 25 YEARS
0.0/ 100
METRIC RATING
279th/ 347
METRIC RANK
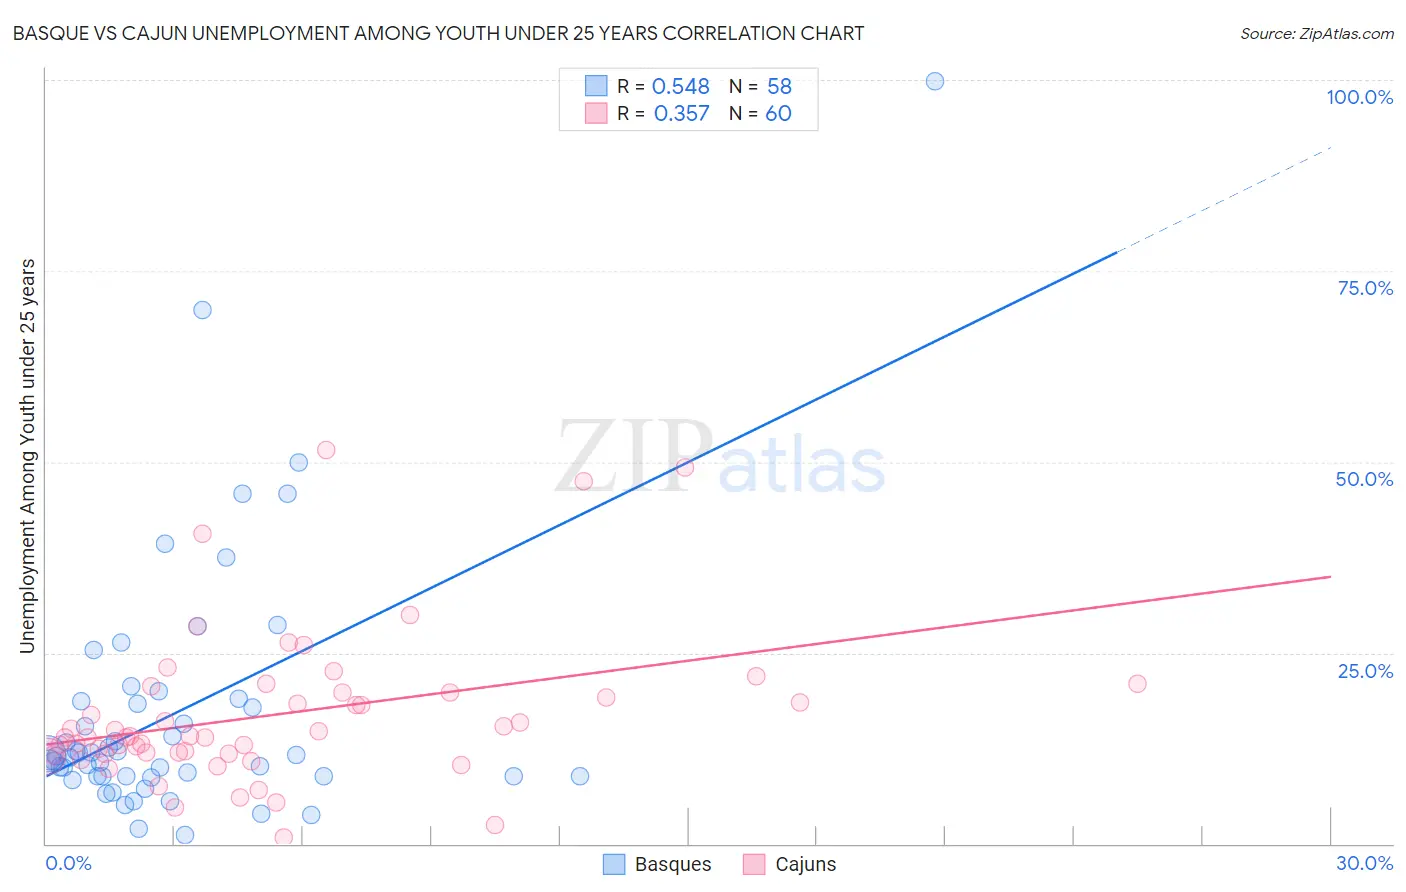
Basque vs Cajun Unemployment Among Youth under 25 years Correlation Chart
The statistical analysis conducted on geographies consisting of 164,926,210 people shows a substantial positive correlation between the proportion of Basques and unemployment rate among youth under the age of 25 in the United States with a correlation coefficient (R) of 0.548 and weighted average of 11.4%. Similarly, the statistical analysis conducted on geographies consisting of 148,147,814 people shows a mild positive correlation between the proportion of Cajuns and unemployment rate among youth under the age of 25 in the United States with a correlation coefficient (R) of 0.357 and weighted average of 13.2%, a difference of 16.5%.
Unemployment Among Youth under 25 years Correlation Summary
| Measurement | Basque | Cajun |
| Minimum | 1.2% | 0.80% |
| Maximum | 99.9% | 51.5% |
| Range | 98.7% | 50.7% |
| Mean | 17.2% | 16.9% |
| Median | 11.6% | 14.0% |
| Interquartile 25% (IQ1) | 8.8% | 11.8% |
| Interquartile 75% (IQ3) | 18.6% | 19.8% |
| Interquartile Range (IQR) | 9.8% | 8.0% |
| Standard Deviation (Sample) | 17.0% | 10.1% |
| Standard Deviation (Population) | 16.9% | 10.0% |
Similar Demographics by Unemployment Among Youth under 25 years
Demographics Similar to Basques by Unemployment Among Youth under 25 years
In terms of unemployment among youth under 25 years, the demographic groups most similar to Basques are Immigrants from Micronesia (11.4%, a difference of 0.020%), Italian (11.4%, a difference of 0.060%), Immigrants from Argentina (11.4%, a difference of 0.070%), Slovak (11.4%, a difference of 0.10%), and Malaysian (11.4%, a difference of 0.12%).
| Demographics | Rating | Rank | Unemployment Among Youth under 25 years |
| Burmese | 89.8 /100 | #116 | Excellent 11.3% |
| Sri Lankans | 89.8 /100 | #117 | Excellent 11.3% |
| Afghans | 89.7 /100 | #118 | Excellent 11.3% |
| Immigrants | Scotland | 89.2 /100 | #119 | Excellent 11.4% |
| Malaysians | 89.0 /100 | #120 | Excellent 11.4% |
| Slovaks | 88.9 /100 | #121 | Excellent 11.4% |
| Immigrants | Micronesia | 88.1 /100 | #122 | Excellent 11.4% |
| Basques | 87.8 /100 | #123 | Excellent 11.4% |
| Italians | 87.2 /100 | #124 | Excellent 11.4% |
| Immigrants | Argentina | 87.2 /100 | #125 | Excellent 11.4% |
| Canadians | 86.6 /100 | #126 | Excellent 11.4% |
| Greeks | 86.2 /100 | #127 | Excellent 11.4% |
| Immigrants | Hungary | 86.0 /100 | #128 | Excellent 11.4% |
| Turks | 85.8 /100 | #129 | Excellent 11.4% |
| Hungarians | 85.7 /100 | #130 | Excellent 11.4% |
Demographics Similar to Cajuns by Unemployment Among Youth under 25 years
In terms of unemployment among youth under 25 years, the demographic groups most similar to Cajuns are Ute (13.3%, a difference of 0.25%), Armenian (13.3%, a difference of 0.28%), Sierra Leonean (13.3%, a difference of 0.29%), Immigrants from Cameroon (13.3%, a difference of 0.32%), and Lumbee (13.3%, a difference of 0.33%).
| Demographics | Rating | Rank | Unemployment Among Youth under 25 years |
| Cape Verdeans | 0.0 /100 | #272 | Tragic 12.9% |
| Nigerians | 0.0 /100 | #273 | Tragic 13.0% |
| Immigrants | Nigeria | 0.0 /100 | #274 | Tragic 13.0% |
| Bermudans | 0.0 /100 | #275 | Tragic 13.0% |
| Immigrants | Uzbekistan | 0.0 /100 | #276 | Tragic 13.1% |
| Bahamians | 0.0 /100 | #277 | Tragic 13.1% |
| Africans | 0.0 /100 | #278 | Tragic 13.2% |
| Cajuns | 0.0 /100 | #279 | Tragic 13.2% |
| Ute | 0.0 /100 | #280 | Tragic 13.3% |
| Armenians | 0.0 /100 | #281 | Tragic 13.3% |
| Sierra Leoneans | 0.0 /100 | #282 | Tragic 13.3% |
| Immigrants | Cameroon | 0.0 /100 | #283 | Tragic 13.3% |
| Lumbee | 0.0 /100 | #284 | Tragic 13.3% |
| Ghanaians | 0.0 /100 | #285 | Tragic 13.3% |
| Blackfeet | 0.0 /100 | #286 | Tragic 13.3% |