Taiwanese vs Cajun Unemployment Among Youth under 25 years
COMPARE
Taiwanese
Cajun
Unemployment Among Youth under 25 years
Unemployment Among Youth under 25 years Comparison
Taiwanese
Cajuns
10.8%
UNEMPLOYMENT AMONG YOUTH UNDER 25 YEARS
99.9/ 100
METRIC RATING
32nd/ 347
METRIC RANK
13.2%
UNEMPLOYMENT AMONG YOUTH UNDER 25 YEARS
0.0/ 100
METRIC RATING
279th/ 347
METRIC RANK
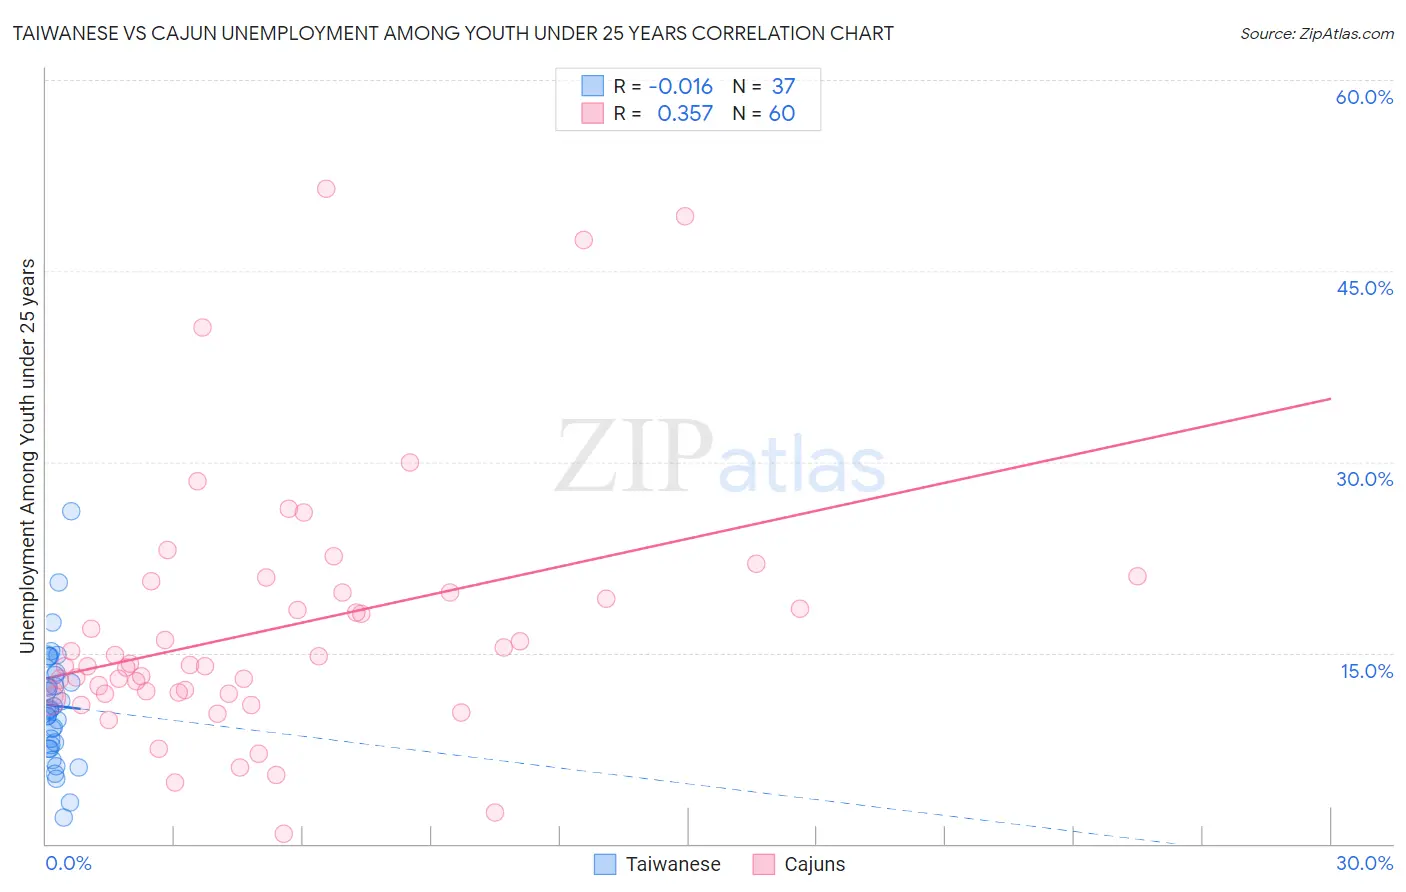
Taiwanese vs Cajun Unemployment Among Youth under 25 years Correlation Chart
The statistical analysis conducted on geographies consisting of 31,706,406 people shows no correlation between the proportion of Taiwanese and unemployment rate among youth under the age of 25 in the United States with a correlation coefficient (R) of -0.016 and weighted average of 10.8%. Similarly, the statistical analysis conducted on geographies consisting of 148,147,814 people shows a mild positive correlation between the proportion of Cajuns and unemployment rate among youth under the age of 25 in the United States with a correlation coefficient (R) of 0.357 and weighted average of 13.2%, a difference of 23.1%.
Unemployment Among Youth under 25 years Correlation Summary
| Measurement | Taiwanese | Cajun |
| Minimum | 2.1% | 0.80% |
| Maximum | 26.1% | 51.5% |
| Range | 24.0% | 50.7% |
| Mean | 10.8% | 16.9% |
| Median | 10.5% | 14.0% |
| Interquartile 25% (IQ1) | 7.6% | 11.8% |
| Interquartile 75% (IQ3) | 13.4% | 19.8% |
| Interquartile Range (IQR) | 5.8% | 8.0% |
| Standard Deviation (Sample) | 4.7% | 10.1% |
| Standard Deviation (Population) | 4.6% | 10.0% |
Similar Demographics by Unemployment Among Youth under 25 years
Demographics Similar to Taiwanese by Unemployment Among Youth under 25 years
In terms of unemployment among youth under 25 years, the demographic groups most similar to Taiwanese are European (10.8%, a difference of 0.22%), Slovene (10.7%, a difference of 0.26%), Osage (10.7%, a difference of 0.37%), Chinese (10.7%, a difference of 0.44%), and English (10.8%, a difference of 0.50%).
| Demographics | Rating | Rank | Unemployment Among Youth under 25 years |
| Immigrants | North Macedonia | 100.0 /100 | #25 | Exceptional 10.7% |
| Immigrants | India | 100.0 /100 | #26 | Exceptional 10.7% |
| Yugoslavians | 100.0 /100 | #27 | Exceptional 10.7% |
| Somalis | 100.0 /100 | #28 | Exceptional 10.7% |
| Chinese | 99.9 /100 | #29 | Exceptional 10.7% |
| Osage | 99.9 /100 | #30 | Exceptional 10.7% |
| Slovenes | 99.9 /100 | #31 | Exceptional 10.7% |
| Taiwanese | 99.9 /100 | #32 | Exceptional 10.8% |
| Europeans | 99.9 /100 | #33 | Exceptional 10.8% |
| English | 99.9 /100 | #34 | Exceptional 10.8% |
| Immigrants | Nepal | 99.9 /100 | #35 | Exceptional 10.8% |
| Hmong | 99.8 /100 | #36 | Exceptional 10.8% |
| Immigrants | Zimbabwe | 99.8 /100 | #37 | Exceptional 10.8% |
| Immigrants | Congo | 99.8 /100 | #38 | Exceptional 10.9% |
| Immigrants | Zaire | 99.8 /100 | #39 | Exceptional 10.9% |
Demographics Similar to Cajuns by Unemployment Among Youth under 25 years
In terms of unemployment among youth under 25 years, the demographic groups most similar to Cajuns are Ute (13.3%, a difference of 0.25%), Armenian (13.3%, a difference of 0.28%), Sierra Leonean (13.3%, a difference of 0.29%), Immigrants from Cameroon (13.3%, a difference of 0.32%), and Lumbee (13.3%, a difference of 0.33%).
| Demographics | Rating | Rank | Unemployment Among Youth under 25 years |
| Cape Verdeans | 0.0 /100 | #272 | Tragic 12.9% |
| Nigerians | 0.0 /100 | #273 | Tragic 13.0% |
| Immigrants | Nigeria | 0.0 /100 | #274 | Tragic 13.0% |
| Bermudans | 0.0 /100 | #275 | Tragic 13.0% |
| Immigrants | Uzbekistan | 0.0 /100 | #276 | Tragic 13.1% |
| Bahamians | 0.0 /100 | #277 | Tragic 13.1% |
| Africans | 0.0 /100 | #278 | Tragic 13.2% |
| Cajuns | 0.0 /100 | #279 | Tragic 13.2% |
| Ute | 0.0 /100 | #280 | Tragic 13.3% |
| Armenians | 0.0 /100 | #281 | Tragic 13.3% |
| Sierra Leoneans | 0.0 /100 | #282 | Tragic 13.3% |
| Immigrants | Cameroon | 0.0 /100 | #283 | Tragic 13.3% |
| Lumbee | 0.0 /100 | #284 | Tragic 13.3% |
| Ghanaians | 0.0 /100 | #285 | Tragic 13.3% |
| Blackfeet | 0.0 /100 | #286 | Tragic 13.3% |