Central American Indian vs Venezuelan Female Unemployment
COMPARE
Central American Indian
Venezuelan
Female Unemployment
Female Unemployment Comparison
Central American Indians
Venezuelans
6.3%
FEMALE UNEMPLOYMENT
0.0/ 100
METRIC RATING
310th/ 347
METRIC RANK
5.0%
FEMALE UNEMPLOYMENT
96.9/ 100
METRIC RATING
87th/ 347
METRIC RANK
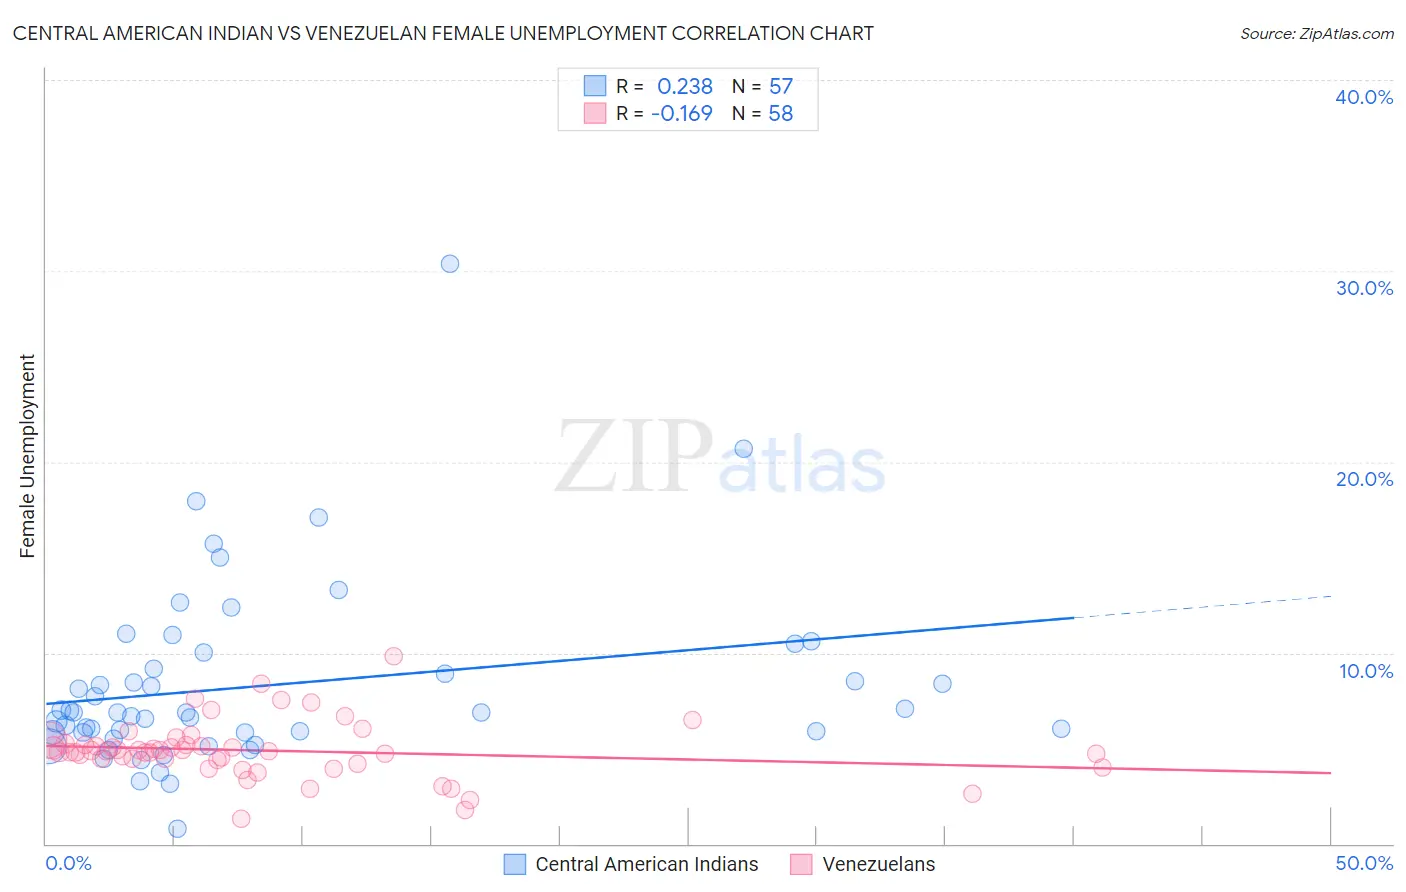
Central American Indian vs Venezuelan Female Unemployment Correlation Chart
The statistical analysis conducted on geographies consisting of 325,404,232 people shows a weak positive correlation between the proportion of Central American Indians and unemploymnet rate among females in the United States with a correlation coefficient (R) of 0.238 and weighted average of 6.3%. Similarly, the statistical analysis conducted on geographies consisting of 305,755,404 people shows a poor negative correlation between the proportion of Venezuelans and unemploymnet rate among females in the United States with a correlation coefficient (R) of -0.169 and weighted average of 5.0%, a difference of 26.2%.
Female Unemployment Correlation Summary
| Measurement | Central American Indian | Venezuelan |
| Minimum | 0.80% | 1.3% |
| Maximum | 30.4% | 9.8% |
| Range | 29.6% | 8.5% |
| Mean | 8.3% | 4.9% |
| Median | 6.9% | 4.8% |
| Interquartile 25% (IQ1) | 5.8% | 4.4% |
| Interquartile 75% (IQ3) | 9.6% | 5.2% |
| Interquartile Range (IQR) | 3.8% | 0.83% |
| Standard Deviation (Sample) | 4.8% | 1.5% |
| Standard Deviation (Population) | 4.8% | 1.5% |
Similar Demographics by Female Unemployment
Demographics Similar to Central American Indians by Female Unemployment
In terms of female unemployment, the demographic groups most similar to Central American Indians are Immigrants from Mexico (6.3%, a difference of 0.13%), Ecuadorian (6.3%, a difference of 0.41%), Immigrants from Grenada (6.3%, a difference of 0.79%), Belizean (6.3%, a difference of 0.81%), and Hispanic or Latino (6.2%, a difference of 0.99%).
| Demographics | Rating | Rank | Female Unemployment |
| Barbadians | 0.0 /100 | #303 | Tragic 6.2% |
| Immigrants | Jamaica | 0.0 /100 | #304 | Tragic 6.2% |
| Spanish American Indians | 0.0 /100 | #305 | Tragic 6.2% |
| Immigrants | Central America | 0.0 /100 | #306 | Tragic 6.2% |
| Shoshone | 0.0 /100 | #307 | Tragic 6.2% |
| Hispanics or Latinos | 0.0 /100 | #308 | Tragic 6.2% |
| Ecuadorians | 0.0 /100 | #309 | Tragic 6.3% |
| Central American Indians | 0.0 /100 | #310 | Tragic 6.3% |
| Immigrants | Mexico | 0.0 /100 | #311 | Tragic 6.3% |
| Immigrants | Grenada | 0.0 /100 | #312 | Tragic 6.3% |
| Belizeans | 0.0 /100 | #313 | Tragic 6.3% |
| Immigrants | Ecuador | 0.0 /100 | #314 | Tragic 6.4% |
| Pueblo | 0.0 /100 | #315 | Tragic 6.4% |
| Houma | 0.0 /100 | #316 | Tragic 6.4% |
| Immigrants | St. Vincent and the Grenadines | 0.0 /100 | #317 | Tragic 6.4% |
Demographics Similar to Venezuelans by Female Unemployment
In terms of female unemployment, the demographic groups most similar to Venezuelans are Bolivian (5.0%, a difference of 0.090%), Immigrants from Sudan (5.0%, a difference of 0.090%), Ukrainian (5.0%, a difference of 0.10%), Canadian (5.0%, a difference of 0.14%), and Immigrants from Taiwan (5.0%, a difference of 0.15%).
| Demographics | Rating | Rank | Female Unemployment |
| New Zealanders | 97.4 /100 | #80 | Exceptional 5.0% |
| Filipinos | 97.3 /100 | #81 | Exceptional 5.0% |
| Immigrants | Australia | 97.3 /100 | #82 | Exceptional 5.0% |
| Immigrants | Serbia | 97.2 /100 | #83 | Exceptional 5.0% |
| Canadians | 97.2 /100 | #84 | Exceptional 5.0% |
| Ukrainians | 97.1 /100 | #85 | Exceptional 5.0% |
| Bolivians | 97.1 /100 | #86 | Exceptional 5.0% |
| Venezuelans | 96.9 /100 | #87 | Exceptional 5.0% |
| Immigrants | Sudan | 96.7 /100 | #88 | Exceptional 5.0% |
| Immigrants | Taiwan | 96.6 /100 | #89 | Exceptional 5.0% |
| Immigrants | Sweden | 96.3 /100 | #90 | Exceptional 5.0% |
| Immigrants | Japan | 96.0 /100 | #91 | Exceptional 5.0% |
| Romanians | 95.9 /100 | #92 | Exceptional 5.0% |
| Immigrants | Austria | 95.7 /100 | #93 | Exceptional 5.0% |
| Immigrants | Malaysia | 95.7 /100 | #94 | Exceptional 5.0% |