Central American Indian vs Subsaharan African Female Unemployment
COMPARE
Central American Indian
Subsaharan African
Female Unemployment
Female Unemployment Comparison
Central American Indians
Sub-Saharan Africans
6.3%
FEMALE UNEMPLOYMENT
0.0/ 100
METRIC RATING
310th/ 347
METRIC RANK
5.7%
FEMALE UNEMPLOYMENT
0.4/ 100
METRIC RATING
256th/ 347
METRIC RANK
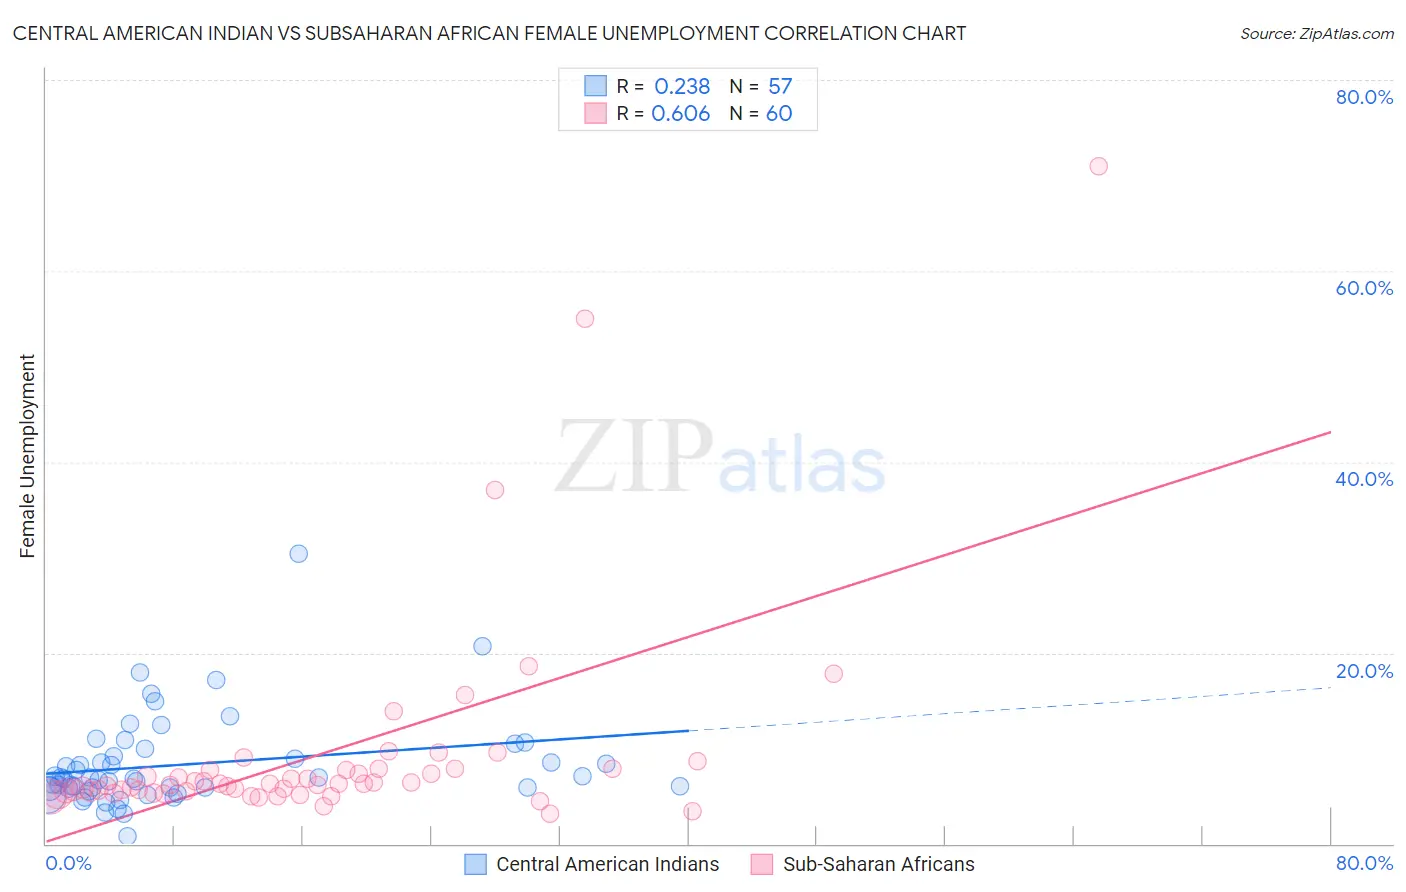
Central American Indian vs Subsaharan African Female Unemployment Correlation Chart
The statistical analysis conducted on geographies consisting of 325,404,232 people shows a weak positive correlation between the proportion of Central American Indians and unemploymnet rate among females in the United States with a correlation coefficient (R) of 0.238 and weighted average of 6.3%. Similarly, the statistical analysis conducted on geographies consisting of 503,774,253 people shows a significant positive correlation between the proportion of Sub-Saharan Africans and unemploymnet rate among females in the United States with a correlation coefficient (R) of 0.606 and weighted average of 5.7%, a difference of 10.4%.
Female Unemployment Correlation Summary
| Measurement | Central American Indian | Subsaharan African |
| Minimum | 0.80% | 3.1% |
| Maximum | 30.4% | 71.0% |
| Range | 29.6% | 67.9% |
| Mean | 8.3% | 9.3% |
| Median | 6.9% | 6.2% |
| Interquartile 25% (IQ1) | 5.8% | 5.5% |
| Interquartile 75% (IQ3) | 9.6% | 7.8% |
| Interquartile Range (IQR) | 3.8% | 2.3% |
| Standard Deviation (Sample) | 4.8% | 11.3% |
| Standard Deviation (Population) | 4.8% | 11.2% |
Similar Demographics by Female Unemployment
Demographics Similar to Central American Indians by Female Unemployment
In terms of female unemployment, the demographic groups most similar to Central American Indians are Immigrants from Mexico (6.3%, a difference of 0.13%), Ecuadorian (6.3%, a difference of 0.41%), Immigrants from Grenada (6.3%, a difference of 0.79%), Belizean (6.3%, a difference of 0.81%), and Hispanic or Latino (6.2%, a difference of 0.99%).
| Demographics | Rating | Rank | Female Unemployment |
| Barbadians | 0.0 /100 | #303 | Tragic 6.2% |
| Immigrants | Jamaica | 0.0 /100 | #304 | Tragic 6.2% |
| Spanish American Indians | 0.0 /100 | #305 | Tragic 6.2% |
| Immigrants | Central America | 0.0 /100 | #306 | Tragic 6.2% |
| Shoshone | 0.0 /100 | #307 | Tragic 6.2% |
| Hispanics or Latinos | 0.0 /100 | #308 | Tragic 6.2% |
| Ecuadorians | 0.0 /100 | #309 | Tragic 6.3% |
| Central American Indians | 0.0 /100 | #310 | Tragic 6.3% |
| Immigrants | Mexico | 0.0 /100 | #311 | Tragic 6.3% |
| Immigrants | Grenada | 0.0 /100 | #312 | Tragic 6.3% |
| Belizeans | 0.0 /100 | #313 | Tragic 6.3% |
| Immigrants | Ecuador | 0.0 /100 | #314 | Tragic 6.4% |
| Pueblo | 0.0 /100 | #315 | Tragic 6.4% |
| Houma | 0.0 /100 | #316 | Tragic 6.4% |
| Immigrants | St. Vincent and the Grenadines | 0.0 /100 | #317 | Tragic 6.4% |
Demographics Similar to Sub-Saharan Africans by Female Unemployment
In terms of female unemployment, the demographic groups most similar to Sub-Saharan Africans are Dutch West Indian (5.7%, a difference of 0.070%), Immigrants from Cameroon (5.7%, a difference of 0.67%), Immigrants from Sierra Leone (5.7%, a difference of 0.71%), Immigrants (5.7%, a difference of 0.71%), and Cajun (5.7%, a difference of 0.85%).
| Demographics | Rating | Rank | Female Unemployment |
| Immigrants | Uzbekistan | 1.0 /100 | #249 | Tragic 5.6% |
| Immigrants | Syria | 0.8 /100 | #250 | Tragic 5.6% |
| Assyrians/Chaldeans/Syriacs | 0.8 /100 | #251 | Tragic 5.6% |
| Cajuns | 0.7 /100 | #252 | Tragic 5.7% |
| Immigrants | Sierra Leone | 0.6 /100 | #253 | Tragic 5.7% |
| Immigrants | Immigrants | 0.6 /100 | #254 | Tragic 5.7% |
| Immigrants | Cameroon | 0.6 /100 | #255 | Tragic 5.7% |
| Sub-Saharan Africans | 0.4 /100 | #256 | Tragic 5.7% |
| Dutch West Indians | 0.3 /100 | #257 | Tragic 5.7% |
| Immigrants | Portugal | 0.2 /100 | #258 | Tragic 5.8% |
| Immigrants | Fiji | 0.2 /100 | #259 | Tragic 5.8% |
| Nigerians | 0.2 /100 | #260 | Tragic 5.8% |
| Kiowa | 0.1 /100 | #261 | Tragic 5.8% |
| Immigrants | Nigeria | 0.1 /100 | #262 | Tragic 5.8% |
| Immigrants | Azores | 0.1 /100 | #263 | Tragic 5.8% |