Immigrants from England vs Venezuelan Female Unemployment
COMPARE
Immigrants from England
Venezuelan
Female Unemployment
Female Unemployment Comparison
Immigrants from England
Venezuelans
5.0%
FEMALE UNEMPLOYMENT
93.6/ 100
METRIC RATING
105th/ 347
METRIC RANK
5.0%
FEMALE UNEMPLOYMENT
96.9/ 100
METRIC RATING
87th/ 347
METRIC RANK
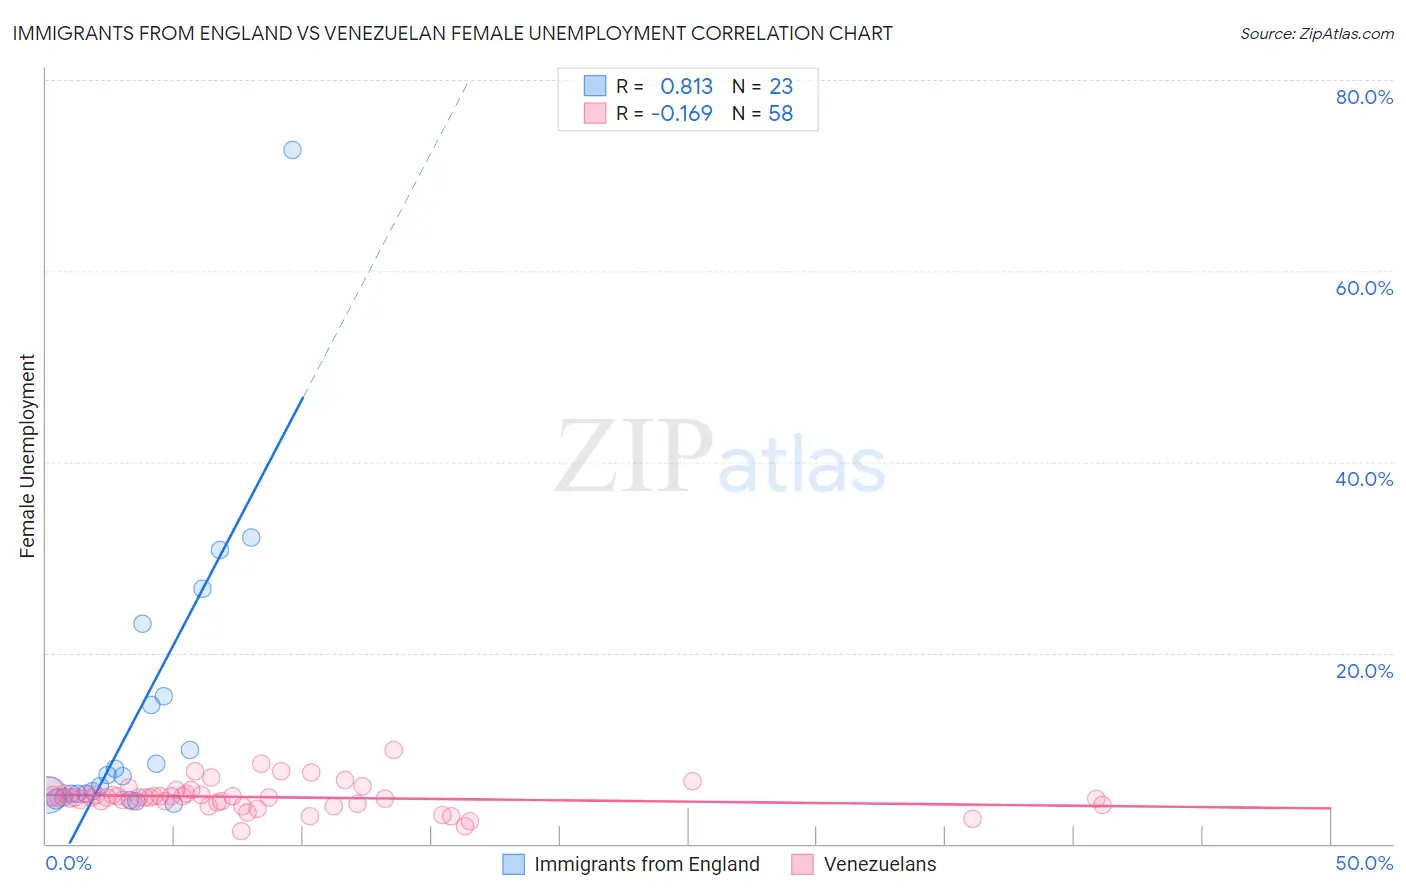
Immigrants from England vs Venezuelan Female Unemployment Correlation Chart
The statistical analysis conducted on geographies consisting of 389,797,734 people shows a very strong positive correlation between the proportion of Immigrants from England and unemploymnet rate among females in the United States with a correlation coefficient (R) of 0.813 and weighted average of 5.0%. Similarly, the statistical analysis conducted on geographies consisting of 305,755,404 people shows a poor negative correlation between the proportion of Venezuelans and unemploymnet rate among females in the United States with a correlation coefficient (R) of -0.169 and weighted average of 5.0%, a difference of 1.2%.
Female Unemployment Correlation Summary
| Measurement | Immigrants from England | Venezuelan |
| Minimum | 4.2% | 1.3% |
| Maximum | 72.7% | 9.8% |
| Range | 68.5% | 8.5% |
| Mean | 13.5% | 4.9% |
| Median | 7.1% | 4.8% |
| Interquartile 25% (IQ1) | 5.1% | 4.4% |
| Interquartile 75% (IQ3) | 15.4% | 5.2% |
| Interquartile Range (IQR) | 10.3% | 0.83% |
| Standard Deviation (Sample) | 15.6% | 1.5% |
| Standard Deviation (Population) | 15.3% | 1.5% |
Demographics Similar to Immigrants from England and Venezuelans by Female Unemployment
In terms of female unemployment, the demographic groups most similar to Immigrants from England are Kenyan (5.0%, a difference of 0.020%), Paraguayan (5.1%, a difference of 0.090%), Somali (5.0%, a difference of 0.28%), Immigrants from Kenya (5.0%, a difference of 0.36%), and Immigrants from Czechoslovakia (5.0%, a difference of 0.41%). Similarly, the demographic groups most similar to Venezuelans are Bolivian (5.0%, a difference of 0.090%), Immigrants from Sudan (5.0%, a difference of 0.090%), Immigrants from Taiwan (5.0%, a difference of 0.15%), Immigrants from Sweden (5.0%, a difference of 0.32%), and Immigrants from Japan (5.0%, a difference of 0.43%).
| Demographics | Rating | Rank | Female Unemployment |
| Bolivians | 97.1 /100 | #86 | Exceptional 5.0% |
| Venezuelans | 96.9 /100 | #87 | Exceptional 5.0% |
| Immigrants | Sudan | 96.7 /100 | #88 | Exceptional 5.0% |
| Immigrants | Taiwan | 96.6 /100 | #89 | Exceptional 5.0% |
| Immigrants | Sweden | 96.3 /100 | #90 | Exceptional 5.0% |
| Immigrants | Japan | 96.0 /100 | #91 | Exceptional 5.0% |
| Romanians | 95.9 /100 | #92 | Exceptional 5.0% |
| Immigrants | Austria | 95.7 /100 | #93 | Exceptional 5.0% |
| Immigrants | Malaysia | 95.7 /100 | #94 | Exceptional 5.0% |
| Burmese | 95.6 /100 | #95 | Exceptional 5.0% |
| Immigrants | South Central Asia | 95.5 /100 | #96 | Exceptional 5.0% |
| Immigrants | Somalia | 95.2 /100 | #97 | Exceptional 5.0% |
| Immigrants | Kuwait | 95.2 /100 | #98 | Exceptional 5.0% |
| Immigrants | Zaire | 95.2 /100 | #99 | Exceptional 5.0% |
| Indonesians | 95.1 /100 | #100 | Exceptional 5.0% |
| Immigrants | Czechoslovakia | 95.0 /100 | #101 | Exceptional 5.0% |
| Immigrants | Kenya | 94.8 /100 | #102 | Exceptional 5.0% |
| Somalis | 94.6 /100 | #103 | Exceptional 5.0% |
| Kenyans | 93.7 /100 | #104 | Exceptional 5.0% |
| Immigrants | England | 93.6 /100 | #105 | Exceptional 5.0% |
| Paraguayans | 93.2 /100 | #106 | Exceptional 5.1% |