Central American Indian vs Alsatian Female Unemployment
COMPARE
Central American Indian
Alsatian
Female Unemployment
Female Unemployment Comparison
Central American Indians
Alsatians
6.3%
FEMALE UNEMPLOYMENT
0.0/ 100
METRIC RATING
310th/ 347
METRIC RANK
5.3%
FEMALE UNEMPLOYMENT
23.9/ 100
METRIC RATING
197th/ 347
METRIC RANK
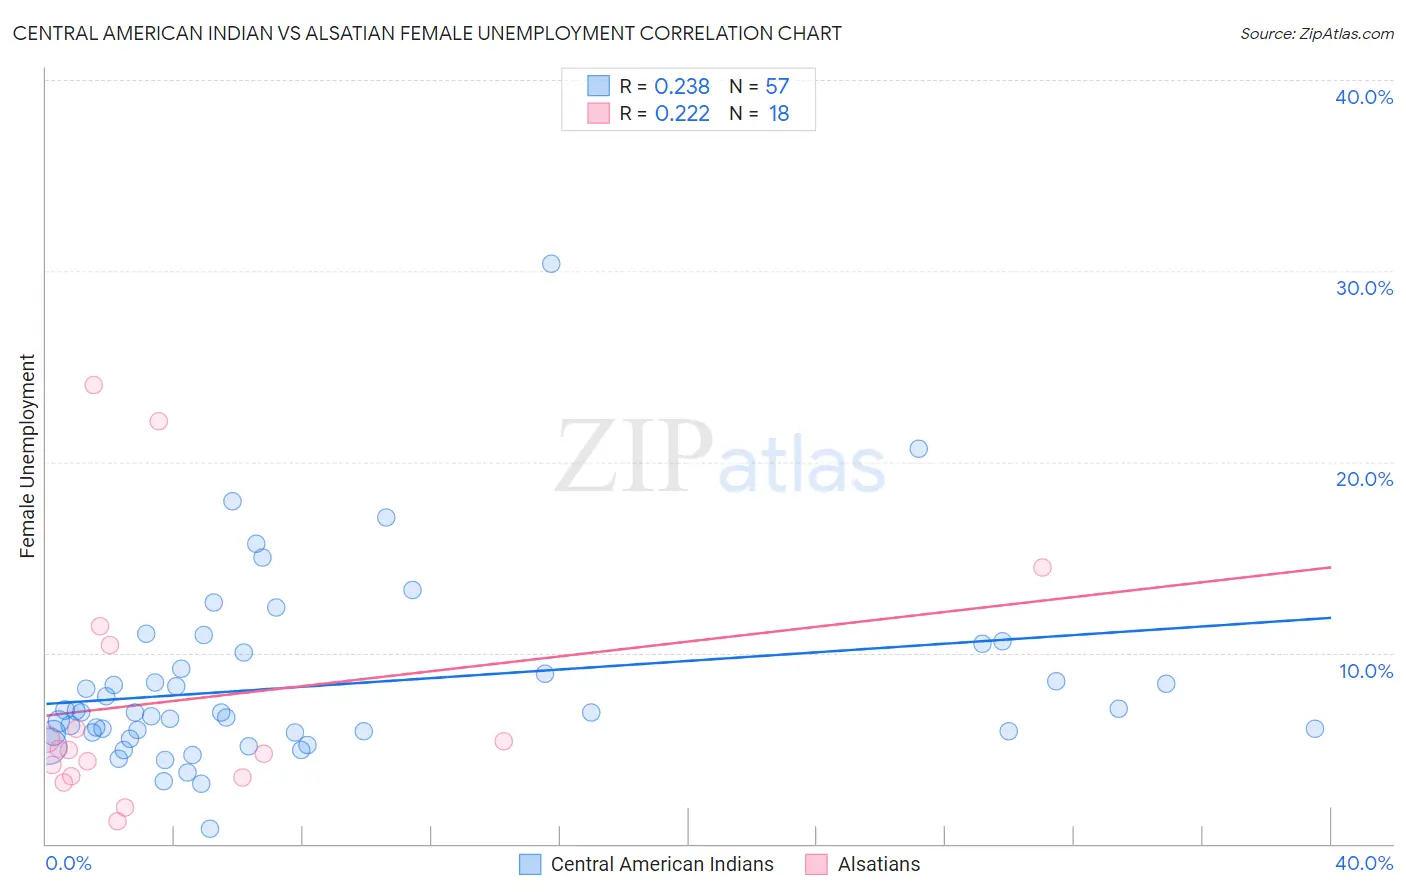
Central American Indian vs Alsatian Female Unemployment Correlation Chart
The statistical analysis conducted on geographies consisting of 325,404,232 people shows a weak positive correlation between the proportion of Central American Indians and unemploymnet rate among females in the United States with a correlation coefficient (R) of 0.238 and weighted average of 6.3%. Similarly, the statistical analysis conducted on geographies consisting of 82,574,814 people shows a weak positive correlation between the proportion of Alsatians and unemploymnet rate among females in the United States with a correlation coefficient (R) of 0.222 and weighted average of 5.3%, a difference of 17.7%.
Female Unemployment Correlation Summary
| Measurement | Central American Indian | Alsatian |
| Minimum | 0.80% | 1.2% |
| Maximum | 30.4% | 24.0% |
| Range | 29.6% | 22.8% |
| Mean | 8.3% | 7.5% |
| Median | 6.9% | 4.9% |
| Interquartile 25% (IQ1) | 5.8% | 3.5% |
| Interquartile 75% (IQ3) | 9.6% | 10.4% |
| Interquartile Range (IQR) | 3.8% | 6.9% |
| Standard Deviation (Sample) | 4.8% | 6.6% |
| Standard Deviation (Population) | 4.8% | 6.4% |
Similar Demographics by Female Unemployment
Demographics Similar to Central American Indians by Female Unemployment
In terms of female unemployment, the demographic groups most similar to Central American Indians are Immigrants from Mexico (6.3%, a difference of 0.13%), Ecuadorian (6.3%, a difference of 0.41%), Immigrants from Grenada (6.3%, a difference of 0.79%), Belizean (6.3%, a difference of 0.81%), and Hispanic or Latino (6.2%, a difference of 0.99%).
| Demographics | Rating | Rank | Female Unemployment |
| Barbadians | 0.0 /100 | #303 | Tragic 6.2% |
| Immigrants | Jamaica | 0.0 /100 | #304 | Tragic 6.2% |
| Spanish American Indians | 0.0 /100 | #305 | Tragic 6.2% |
| Immigrants | Central America | 0.0 /100 | #306 | Tragic 6.2% |
| Shoshone | 0.0 /100 | #307 | Tragic 6.2% |
| Hispanics or Latinos | 0.0 /100 | #308 | Tragic 6.2% |
| Ecuadorians | 0.0 /100 | #309 | Tragic 6.3% |
| Central American Indians | 0.0 /100 | #310 | Tragic 6.3% |
| Immigrants | Mexico | 0.0 /100 | #311 | Tragic 6.3% |
| Immigrants | Grenada | 0.0 /100 | #312 | Tragic 6.3% |
| Belizeans | 0.0 /100 | #313 | Tragic 6.3% |
| Immigrants | Ecuador | 0.0 /100 | #314 | Tragic 6.4% |
| Pueblo | 0.0 /100 | #315 | Tragic 6.4% |
| Houma | 0.0 /100 | #316 | Tragic 6.4% |
| Immigrants | St. Vincent and the Grenadines | 0.0 /100 | #317 | Tragic 6.4% |
Demographics Similar to Alsatians by Female Unemployment
In terms of female unemployment, the demographic groups most similar to Alsatians are Tsimshian (5.4%, a difference of 0.070%), Spaniard (5.3%, a difference of 0.10%), Hawaiian (5.4%, a difference of 0.14%), Immigrants from Colombia (5.3%, a difference of 0.18%), and Soviet Union (5.4%, a difference of 0.19%).
| Demographics | Rating | Rank | Female Unemployment |
| Ugandans | 31.2 /100 | #190 | Fair 5.3% |
| Cherokee | 30.8 /100 | #191 | Fair 5.3% |
| Portuguese | 28.6 /100 | #192 | Fair 5.3% |
| Arabs | 27.7 /100 | #193 | Fair 5.3% |
| Colombians | 27.0 /100 | #194 | Fair 5.3% |
| Immigrants | Colombia | 26.2 /100 | #195 | Fair 5.3% |
| Spaniards | 25.2 /100 | #196 | Fair 5.3% |
| Alsatians | 23.9 /100 | #197 | Fair 5.3% |
| Tsimshian | 23.1 /100 | #198 | Fair 5.4% |
| Hawaiians | 22.2 /100 | #199 | Fair 5.4% |
| Soviet Union | 21.7 /100 | #200 | Fair 5.4% |
| Immigrants | Middle Africa | 20.8 /100 | #201 | Fair 5.4% |
| Iroquois | 20.8 /100 | #202 | Fair 5.4% |
| Immigrants | South Eastern Asia | 20.3 /100 | #203 | Fair 5.4% |
| Immigrants | Israel | 19.7 /100 | #204 | Poor 5.4% |