Immigrants from Singapore vs Alsatian Female Unemployment
COMPARE
Immigrants from Singapore
Alsatian
Female Unemployment
Female Unemployment Comparison
Immigrants from Singapore
Alsatians
5.0%
FEMALE UNEMPLOYMENT
98.0/ 100
METRIC RATING
75th/ 347
METRIC RANK
5.3%
FEMALE UNEMPLOYMENT
23.9/ 100
METRIC RATING
197th/ 347
METRIC RANK
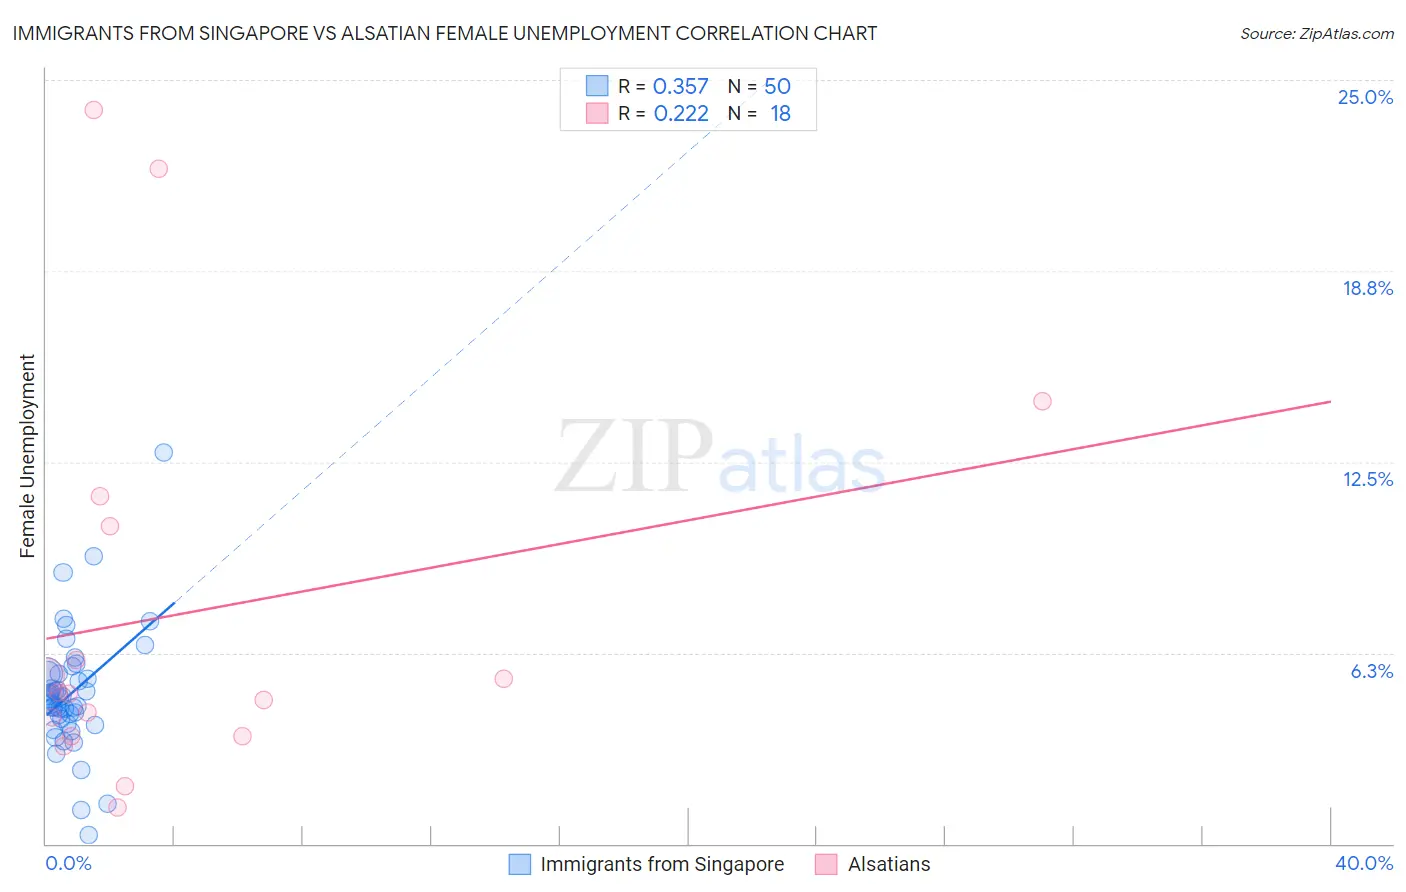
Immigrants from Singapore vs Alsatian Female Unemployment Correlation Chart
The statistical analysis conducted on geographies consisting of 137,404,141 people shows a mild positive correlation between the proportion of Immigrants from Singapore and unemploymnet rate among females in the United States with a correlation coefficient (R) of 0.357 and weighted average of 5.0%. Similarly, the statistical analysis conducted on geographies consisting of 82,574,814 people shows a weak positive correlation between the proportion of Alsatians and unemploymnet rate among females in the United States with a correlation coefficient (R) of 0.222 and weighted average of 5.3%, a difference of 8.0%.
Female Unemployment Correlation Summary
| Measurement | Immigrants from Singapore | Alsatian |
| Minimum | 0.30% | 1.2% |
| Maximum | 12.8% | 24.0% |
| Range | 12.5% | 22.8% |
| Mean | 4.9% | 7.5% |
| Median | 4.7% | 4.9% |
| Interquartile 25% (IQ1) | 4.1% | 3.5% |
| Interquartile 75% (IQ3) | 5.6% | 10.4% |
| Interquartile Range (IQR) | 1.5% | 6.9% |
| Standard Deviation (Sample) | 2.0% | 6.6% |
| Standard Deviation (Population) | 2.0% | 6.4% |
Similar Demographics by Female Unemployment
Demographics Similar to Immigrants from Singapore by Female Unemployment
In terms of female unemployment, the demographic groups most similar to Immigrants from Singapore are Immigrants from Venezuela (5.0%, a difference of 0.010%), Immigrants from Bolivia (5.0%, a difference of 0.020%), Russian (5.0%, a difference of 0.030%), Immigrants from Northern Europe (4.9%, a difference of 0.060%), and Mongolian (5.0%, a difference of 0.10%).
| Demographics | Rating | Rank | Female Unemployment |
| Tlingit-Haida | 98.3 /100 | #68 | Exceptional 4.9% |
| Immigrants | Ireland | 98.2 /100 | #69 | Exceptional 4.9% |
| Osage | 98.2 /100 | #70 | Exceptional 4.9% |
| German Russians | 98.1 /100 | #71 | Exceptional 4.9% |
| Immigrants | Northern Europe | 98.0 /100 | #72 | Exceptional 4.9% |
| Russians | 98.0 /100 | #73 | Exceptional 5.0% |
| Immigrants | Bolivia | 98.0 /100 | #74 | Exceptional 5.0% |
| Immigrants | Singapore | 98.0 /100 | #75 | Exceptional 5.0% |
| Immigrants | Venezuela | 97.9 /100 | #76 | Exceptional 5.0% |
| Mongolians | 97.8 /100 | #77 | Exceptional 5.0% |
| Immigrants | Netherlands | 97.8 /100 | #78 | Exceptional 5.0% |
| Turks | 97.6 /100 | #79 | Exceptional 5.0% |
| New Zealanders | 97.4 /100 | #80 | Exceptional 5.0% |
| Filipinos | 97.3 /100 | #81 | Exceptional 5.0% |
| Immigrants | Australia | 97.3 /100 | #82 | Exceptional 5.0% |
Demographics Similar to Alsatians by Female Unemployment
In terms of female unemployment, the demographic groups most similar to Alsatians are Tsimshian (5.4%, a difference of 0.070%), Spaniard (5.3%, a difference of 0.10%), Hawaiian (5.4%, a difference of 0.14%), Immigrants from Colombia (5.3%, a difference of 0.18%), and Soviet Union (5.4%, a difference of 0.19%).
| Demographics | Rating | Rank | Female Unemployment |
| Ugandans | 31.2 /100 | #190 | Fair 5.3% |
| Cherokee | 30.8 /100 | #191 | Fair 5.3% |
| Portuguese | 28.6 /100 | #192 | Fair 5.3% |
| Arabs | 27.7 /100 | #193 | Fair 5.3% |
| Colombians | 27.0 /100 | #194 | Fair 5.3% |
| Immigrants | Colombia | 26.2 /100 | #195 | Fair 5.3% |
| Spaniards | 25.2 /100 | #196 | Fair 5.3% |
| Alsatians | 23.9 /100 | #197 | Fair 5.3% |
| Tsimshian | 23.1 /100 | #198 | Fair 5.4% |
| Hawaiians | 22.2 /100 | #199 | Fair 5.4% |
| Soviet Union | 21.7 /100 | #200 | Fair 5.4% |
| Immigrants | Middle Africa | 20.8 /100 | #201 | Fair 5.4% |
| Iroquois | 20.8 /100 | #202 | Fair 5.4% |
| Immigrants | South Eastern Asia | 20.3 /100 | #203 | Fair 5.4% |
| Immigrants | Israel | 19.7 /100 | #204 | Poor 5.4% |