Immigrants from Saudi Arabia vs Paiute Male Unemployment
COMPARE
Immigrants from Saudi Arabia
Paiute
Male Unemployment
Male Unemployment Comparison
Immigrants from Saudi Arabia
Paiute
5.2%
MALE UNEMPLOYMENT
80.1/ 100
METRIC RATING
135th/ 347
METRIC RANK
7.7%
MALE UNEMPLOYMENT
0.0/ 100
METRIC RATING
327th/ 347
METRIC RANK
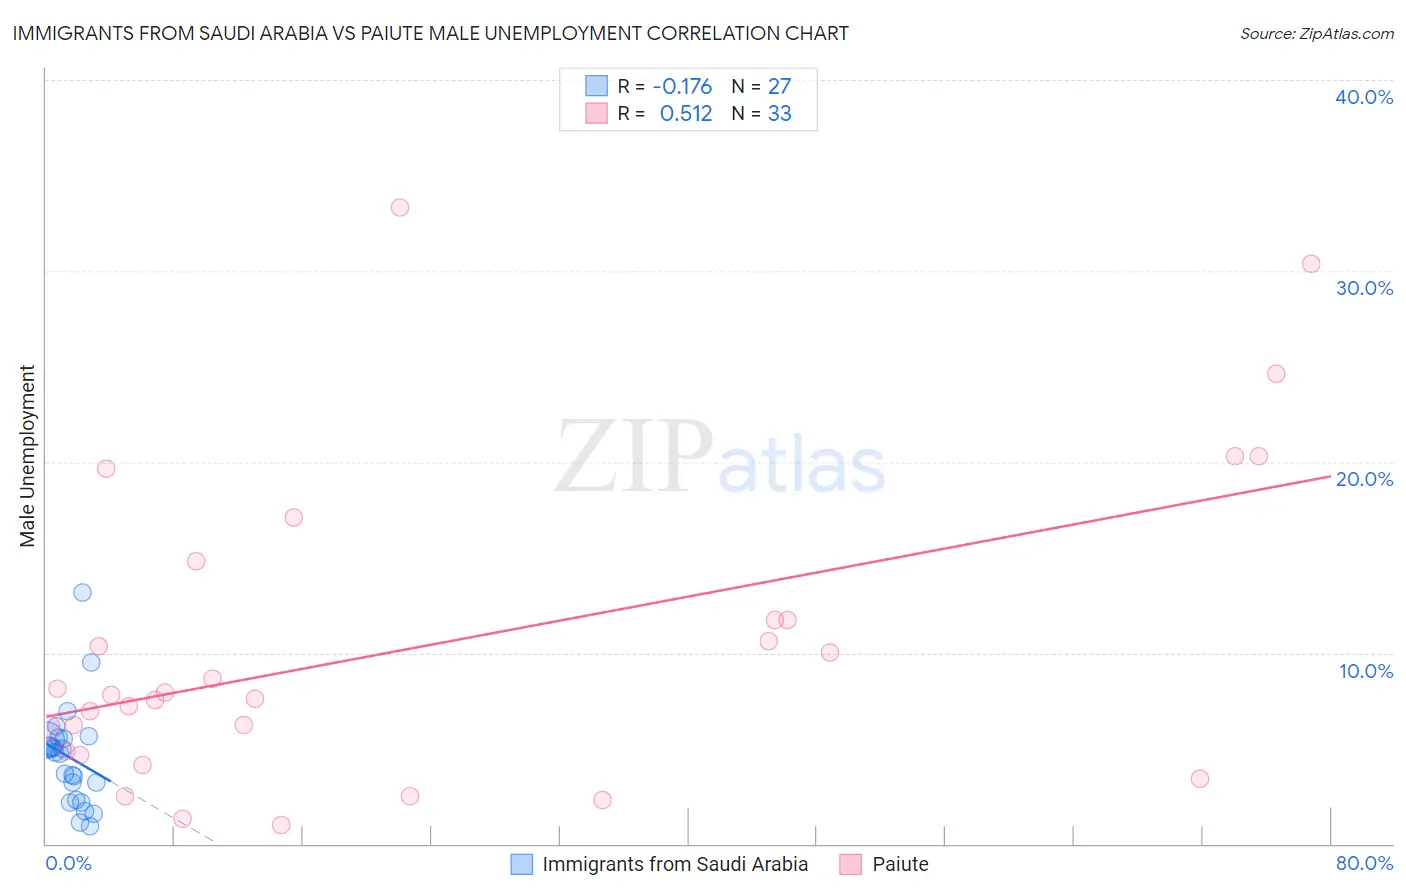
Immigrants from Saudi Arabia vs Paiute Male Unemployment Correlation Chart
The statistical analysis conducted on geographies consisting of 164,168,129 people shows a poor negative correlation between the proportion of Immigrants from Saudi Arabia and unemployment rate among males in the United States with a correlation coefficient (R) of -0.176 and weighted average of 5.2%. Similarly, the statistical analysis conducted on geographies consisting of 58,346,230 people shows a substantial positive correlation between the proportion of Paiute and unemployment rate among males in the United States with a correlation coefficient (R) of 0.512 and weighted average of 7.7%, a difference of 48.3%.
Male Unemployment Correlation Summary
| Measurement | Immigrants from Saudi Arabia | Paiute |
| Minimum | 0.90% | 1.0% |
| Maximum | 13.2% | 33.3% |
| Range | 12.3% | 32.3% |
| Mean | 4.5% | 10.4% |
| Median | 4.8% | 7.8% |
| Interquartile 25% (IQ1) | 2.3% | 4.8% |
| Interquartile 75% (IQ3) | 5.5% | 13.3% |
| Interquartile Range (IQR) | 3.2% | 8.5% |
| Standard Deviation (Sample) | 2.6% | 8.1% |
| Standard Deviation (Population) | 2.6% | 8.0% |
Similar Demographics by Male Unemployment
Demographics Similar to Immigrants from Saudi Arabia by Male Unemployment
In terms of male unemployment, the demographic groups most similar to Immigrants from Saudi Arabia are Lebanese (5.2%, a difference of 0.020%), Pakistani (5.2%, a difference of 0.030%), Immigrants from Eastern Africa (5.2%, a difference of 0.030%), Immigrants from Croatia (5.2%, a difference of 0.040%), and Kenyan (5.2%, a difference of 0.060%).
| Demographics | Rating | Rank | Male Unemployment |
| Hungarians | 85.1 /100 | #128 | Excellent 5.2% |
| Immigrants | Western Europe | 84.8 /100 | #129 | Excellent 5.2% |
| Immigrants | Malaysia | 83.5 /100 | #130 | Excellent 5.2% |
| Immigrants | Germany | 83.0 /100 | #131 | Excellent 5.2% |
| Chickasaw | 82.9 /100 | #132 | Excellent 5.2% |
| Colombians | 81.1 /100 | #133 | Excellent 5.2% |
| Pakistanis | 80.5 /100 | #134 | Excellent 5.2% |
| Immigrants | Saudi Arabia | 80.1 /100 | #135 | Excellent 5.2% |
| Lebanese | 79.9 /100 | #136 | Good 5.2% |
| Immigrants | Eastern Africa | 79.8 /100 | #137 | Good 5.2% |
| Immigrants | Croatia | 79.7 /100 | #138 | Good 5.2% |
| Kenyans | 79.4 /100 | #139 | Good 5.2% |
| Brazilians | 79.3 /100 | #140 | Good 5.2% |
| Immigrants | Switzerland | 79.2 /100 | #141 | Good 5.2% |
| Fijians | 78.3 /100 | #142 | Good 5.2% |
Demographics Similar to Paiute by Male Unemployment
In terms of male unemployment, the demographic groups most similar to Paiute are Native/Alaskan (7.7%, a difference of 0.38%), Immigrants from Dominican Republic (7.6%, a difference of 1.1%), Shoshone (7.6%, a difference of 1.2%), Immigrants from Yemen (7.8%, a difference of 1.3%), and Dominican (7.6%, a difference of 1.6%).
| Demographics | Rating | Rank | Male Unemployment |
| Colville | 0.0 /100 | #320 | Tragic 7.4% |
| Immigrants | St. Vincent and the Grenadines | 0.0 /100 | #321 | Tragic 7.5% |
| Immigrants | Cabo Verde | 0.0 /100 | #322 | Tragic 7.5% |
| Immigrants | Grenada | 0.0 /100 | #323 | Tragic 7.6% |
| Dominicans | 0.0 /100 | #324 | Tragic 7.6% |
| Shoshone | 0.0 /100 | #325 | Tragic 7.6% |
| Immigrants | Dominican Republic | 0.0 /100 | #326 | Tragic 7.6% |
| Paiute | 0.0 /100 | #327 | Tragic 7.7% |
| Natives/Alaskans | 0.0 /100 | #328 | Tragic 7.7% |
| Immigrants | Yemen | 0.0 /100 | #329 | Tragic 7.8% |
| Yakama | 0.0 /100 | #330 | Tragic 7.9% |
| Alaska Natives | 0.0 /100 | #331 | Tragic 8.1% |
| Pima | 0.0 /100 | #332 | Tragic 8.3% |
| Sioux | 0.0 /100 | #333 | Tragic 8.4% |
| Tsimshian | 0.0 /100 | #334 | Tragic 8.5% |